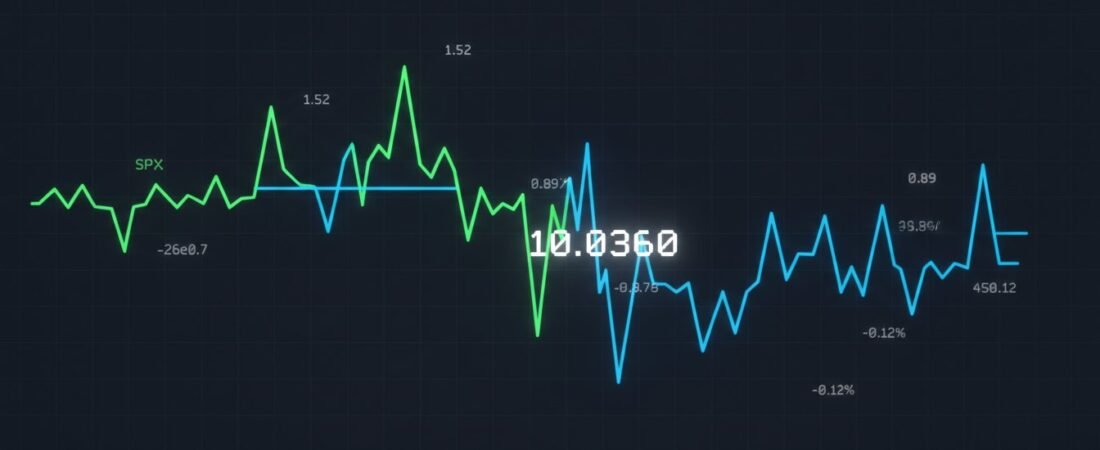
The 10x multiplier is a mathematical fallacy that triggers strike price slippage during peak liquidity events. Current data establishes the spx spy ratio market hours baseline at 10.0360 as of July 2026. Manual conversion attempts during the 9:30 AM to 10:00 AM ET window, where SPY volatility averages ±0.25%, frequently result in execution errors. These inaccuracies stem from a failure to account for real-time ratio drift and multiplier deviation in fast-moving environments.
Traders require precise mapping to manage 0DTE risk and maintain margin efficiency under the new June 2026 intraday standards. This analysis defines how market hour phases dictate SPX:SPY ratio stability and strike price conversion accuracy for active participants. We evaluate the 62% frequency of session extremes occurring in opening and closing hours, the impact of the July 1, 2026 Options Regulatory Fee updates, and the technical requirements for maintaining 6-second refresh intervals during high-volatility sequences.
Key Takeaways
- Identify the 10.0360 baseline ratio and the execution risks of assuming a static 10x multiplier during high-volatility sessions.
- Analyze how spx spy ratio market hours dictate spread width and ratio stability, particularly during the 9:30 AM ET opening window.
- Evaluate the impact of dividend accrual and arbitrage mechanics on ratio drift to prevent strike price slippage in 0DTE strategies.
- Execute precise strike mapping using real-time data to avoid out-of-the-money traps caused by 0.01 ratio shifts.
- Implement a 6-second refresh workflow for live ratio tracking to maintain conversion accuracy across all regular and extended trading phases.
Understanding the SPX:SPY Ratio and Market Hour Dynamics
The SPX:SPY ratio defines the mathematical correlation between the S&P 500 index and the SPDR S&P 500 ETF Trust. While the theoretical multiplier remains 10.00, live market data as of July 2026 establishes a realized baseline of 10.0360. This variance necessitates continuous monitoring for precise trade execution. Intraday traders must analyze how spx spy ratio market hours influence price alignment. Stability depends on participant volume and liquidity depth across different session phases. Inaccurate strike price selection during high-volatility windows results in immediate slippage.
The 10x Multiplier Benchmark
Structural design dictates that SPY represents 1/10th of the index value. This relationship facilitates cross-asset valuation and hedging. Historically, the 10x multiplier allowed market participants to estimate equivalent strikes rapidly. However, the realized ratio has drifted from this integer due to cumulative tracking factors and expenses. The 10x ratio serves as the theoretical baseline for mapping SPX strike prices to SPY equivalents. Relying on this static figure without verifying the current 10.0360 spot rate introduces significant execution risk for 0DTE strategies.
Why the Ratio Fluctuates Intraday
Ratio drift occurs through tracking errors and management fees inherent in the ETF structure. SPY prices reflect real-time supply and demand for fund shares. This often deviates from the net asset value of the underlying index components. Arbitrage mechanics play a critical role here. Authorized participants utilize creation and redemption units to align prices. High-volume periods facilitate tighter ratio synchronization. Dividend accrual also impacts the spread. SPY price adjustments reflect upcoming distributions. SPX is a price return index and doesn’t account for these cash flows. Liquidity gaps further complicate the relationship. Pre-market and after-hours sessions exhibit wider bid-ask spreads. This causes the ratio to fluctuate more aggressively than during regular hours.
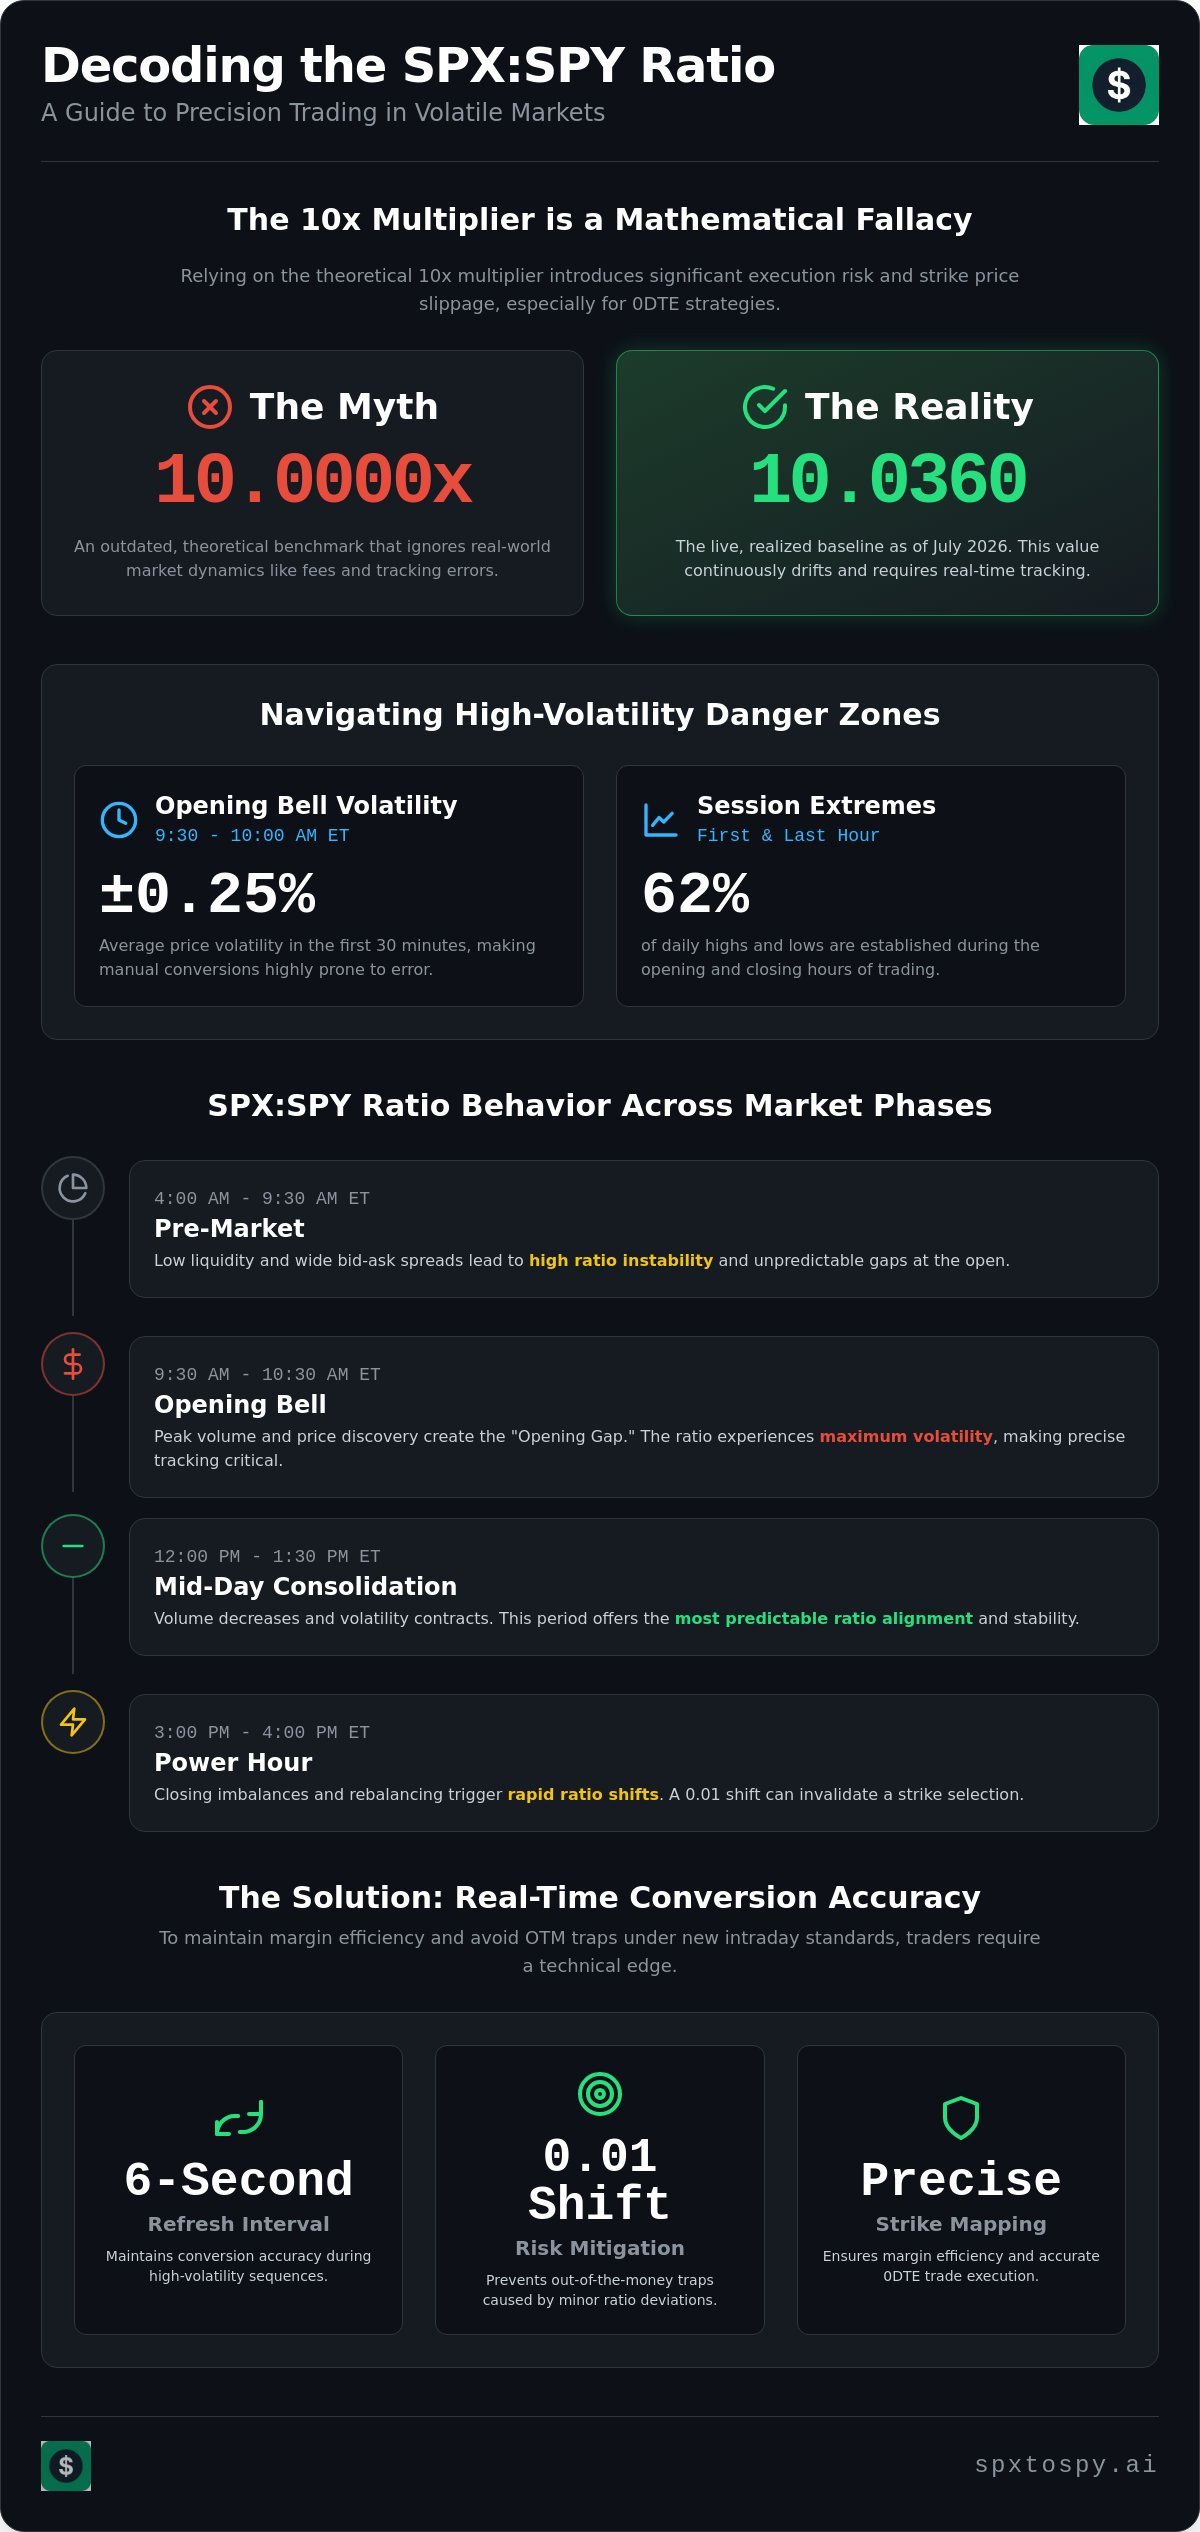
Volatility during spx spy ratio market hours typically peaks between 9:30 AM and 10:00 AM ET. Data confirms an average absolute return of ±0.25% during this initial 30-minute window. Approximately 62% of daily highs and lows are established during the first or last hour of trading. These periods of intense activity require 6-second refresh intervals to maintain conversion accuracy. Manual calculations during these spikes are prone to error. Professional traders prioritize live ratio tracking to mitigate tracking error risk. Precise mapping ensures that SPX strikes convert to the correct SPY status. This prevents entering trades based on lagging data points.
Ratio Behavior Across Different Market Hour Phases
Market efficiency is not constant. It fluctuates across four distinct temporal phases. spx spy ratio market hours dictate the precision of strike mapping through varying liquidity profiles. Pre-market sessions (4:00 AM – 9:30 AM ET) feature low liquidity. This leads to wider bid-ask spreads and ratio instability. Regular market hours (9:30 AM – 4:00 PM ET) offer maximum efficiency. Arbitrageurs tighten the ratio during this period. Post-market (4:00 PM – 8:00 PM ET) introduces price discovery lag. Ratio drift increases as volume exits the ETF. Overnight sessions are influenced by E-mini S&P 500 futures (ES). These global movements set the baseline for the opening ratio.
Pre-Market and Opening Bell Volatility
The “Opening Gap” creates immediate conversion discrepancies. SPX reflects the index value. SPY reflects fund share trading. These values often decouple at 9:30 AM ET. Data indicates SPY volatility averages ±0.25% in the first 30 minutes of regular trading. Conversion tools are essential during the initial 15 minutes of trade. Rapid price discovery makes manual mapping impossible. Traders should utilize a spx spy ratio tracker to monitor these shifts. High-frequency updates prevent entering positions at inaccurate strikes.
Mid-Day Consolidation and Late-Day Rallies
Ratio stabilization occurs during the “lunch hour” from 12:00 PM to 1:30 PM ET. Volume decreases. Spread volatility contracts. This period offers the most predictable ratio alignment. Conversely, deviation increases during the “Power Hour” from 3:00 PM to 4:00 PM ET. Closing imbalances and fund rebalancing trigger rapid ratio shifts. NAV tracking errors and dividend accrual effects become more pronounced as daily volume matures. A 0.01 ratio shift can invalidate a strike selection. 0DTE traders must adjust execution logic during these windows. Utilizing live market ratio tracking ensures that mapping remains accurate during terminal session volatility.
Post-market activity reflects a divergence between index settlement and ETF trading. SPX options are cash-settled. SPY options are physically settled. This distinction impacts the ratio as the 4:15 PM ET curb session approaches. Approximately 62% of daily highs and lows are established during the first or last hour. These bookend periods represent the highest risk for ratio drift. Tracking the relationship across all spx spy ratio market hours is mandatory for risk management.
Technical Drivers of Ratio Deviation in 2026
Technical divergence between SPX and SPY stems from structural variables. SPY’s 0.09% expense ratio and quarterly dividend distributions create a cumulative tracking error against the price-return S&P 500 index. These factors push the spx spy ratio market hours baseline to the current 10.0360 level. Volatility (VIX) acts as a multiplier for this deviation. During periods of high VIX, bid-ask spreads widen. This prevents instantaneous arbitrage and forces the ratio into wider intraday fluctuations. Traders must monitor these mechanical shifts to maintain execution precision. Understanding spx spy ratio volatility patterns and historical drift mechanics provides essential context for anticipating how the 0.0945% expense ratio and dividend yield divergence compound over time to produce the realized 10.0360 baseline.
Dividend Impact on Strike Mapping
SPY dividend distributions reduce the ETF’s net asset value (NAV) relative to the SPX index. This creates a predictable drift in the ratio during ex-dividend weeks. Traders must adjust strike price expectations to account for this denominator reduction. Failure to calibrate for dividend-induced gaps leads to improper strike mapping. SPX does not adjust for cash dividends. This fundamental difference ensures the 10.00 theoretical value remains unreachable in live environments. Strike selection must reflect the realized spot ratio rather than historical benchmarks. Traders managing delta-neutral positions should also account for the spx spy ratio effect on options greeks, as the 10.09 realized deviation directly impacts delta dollar calculations and requires normalization adjustments across SPX and SPY contract legs.
High-Frequency Trading and Arbitrage
High-frequency trading algorithms exploit micro-spreads between the index and the ETF. Authorized participants (APs) maintain the link through creation and redemption units. This process is most efficient during regular market hours. Efficiency degrades during the 4:00 PM to 4:15 PM ET curb session. 6-second refreshes are mandatory to capture these arbitrage-driven shifts. Utilizing a high-frequency spx spy ratio refresh allows traders to identify when the ratio is returning to mean or drifting toward session extremes. Rapid data refreshes mitigate the risk of entering positions during temporary decoupling events.
Cash settlement in SPX versus physical delivery in SPY creates divergent risk profiles. Settlement dynamics impact the ratio as expiration approaches. The July 1, 2026 Options Regulatory Fee (ORF) updates further alter the cost basis of these trades. These regulatory costs affect market maker hedging behavior. This shift influences the speed at which the SPX:SPY ratio stabilizes following a volatility event. Precise mapping requires accounting for these underlying mechanical drivers across all spx spy ratio market hours. Reliance on static multipliers during these technical shifts results in strike price slippage.
Conversion Accuracy Requirements for 0DTE Trading
0DTE trading environments demand absolute mathematical precision. A 0.01 ratio deviation during peak spx spy ratio market hours invalidates strike price selection. This shift transforms an At-The-Money (ATM) contract into an Out-The-Money (OTM) trap within seconds. Traders must calibrate mapping to the realized 10.0360 baseline. Relying on the 10x multiplier results in immediate slippage. Precise conversion is mandatory for risk management and stop-loss placement across Robinhood, Thinkorswim, and Interactive Brokers platforms.
Risk management protocols depend on the correlation between the index and the ETF. Setting a stop-loss on an SPX position using SPY price levels requires a live ratio. If the ratio drifts by 0.05 intraday, the stop-loss trigger price becomes invalid. This leads to either premature exits or catastrophic drawdowns. The new June 2026 intraday margin standards heighten the need for this accuracy. Traders must manage accounts with a $2,000 minimum balance; every tick of slippage now impacts a larger percentage of the total capital base.
Precision Scaling for Scalpers
Scalping workflows require 4-decimal precision. Rounding to the nearest whole number is insufficient for 0DTE execution. A minor rounding error leads to entering the wrong contract leg. Integrating 0dte spx spy ratio data ensures strike mapping remains aligned with current spot values. High-frequency scalpers must avoid integer-based approximations during fast-moving tape. Accurate scaling allows for the identification of the exact SPY equivalent for any SPX strike. This is vital when trading 0DTE spreads where profit margins are thin.
Mitigating Conversion Lag
Retail brokerage feeds exhibit inherent data latency. Standard retail platforms often provide lagging ratio values that don’t reflect live arbitrage cycles. Verification protocols require independent real-time conversion utilities. Cross-check strikes before order entry to prevent execution errors. Utilizing the Real-Time SPX to SPY Strike Price Converter provides the necessary 6-second refresh frequency to navigate market-open volatility. Verified data refresh intervals are critical for maintaining synchronization between the index and the ETF.
Platform-specific nuances impact execution. Robinhood users lack native SPX/SPY ratio tools. Thinkorswim requires manual script configuration for real-time tracking. Interactive Brokers (IBKR) offers deep liquidity but requires external verification for ratio accuracy. The 0.01 shift impact: If SPX is at 5500, a 10.00 ratio implies a 550 SPY strike. At the 10.0360 realized ratio, the actual SPY equivalent is approximately 548.03. This 2-point difference in the ETF strike selection creates a misalignment that ruins delta-neutral or credit spread strategies. Maintaining 6-second refresh cycles is the only method to prevent these technical failures.
Utilizing the Real-Time SPX to SPY Converter
Operational efficiency in 0DTE environments depends on automated data processing. The converter utilizes 6-second refresh intervals to monitor the realized 10.0360 ratio baseline. During spx spy ratio market hours, manual strike mapping introduces unacceptable execution latency. Users input specific SPX strike prices to receive instantaneous SPY equivalents. This workflow reduces cognitive load during high-velocity price action. It allows traders to focus on order entry rather than mathematical conversion. The tool functions as a precision instrument for navigating intraday volatility.
- Input Variable: SPX Strike Price
- Processing: Live Ratio Multiplier Application
- Output Variable: SPY Equivalent Strike
- Update Frequency: 6-Second Refresh Cycles
Strategic advantages materialize during peak volatility windows. Data confirms that 62% of daily highs and lows occur in the first or last hour of trade. The tool captures ratio-driven opportunities as arbitrageurs align the ETF with the index. This precision is critical following the June 4, 2026 elimination of the Pattern Day Trader (PDT) rule. Lower account minimums of $2,000 have increased the number of active participants. Accurate mapping prevents capital erosion caused by strike price slippage. The converter provides a dedicated layer for maintaining synchronization between the index and the ETF.
Real-Time Data Architecture
The system processes live S&P 500 index feeds against real-time SPY pricing. High-frequency updates ensure that tracking error and premium/discount variables are accounted for. Accessing the spx to spy converter provides immediate strike price mapping utility. This architecture bypasses the data latency found in standard retail brokerage feeds. It provides a dedicated utility for navigating technical drivers of ratio deviation, such as the July 1, 2026 Options Regulatory Fee (ORF) updates. These regulatory shifts alter market maker hedging costs, making real-time tracking mandatory for strike selection.
Risk Disclaimer and Verification
The utility acts as a decision-support instrument. It doesn’t provide financial advisory services or direct trade execution. Final strike price verification on the broker platform is mandatory. Market conditions during spx spy ratio market hours can trigger temporary decoupling events. This is particularly relevant during the new extended trading hours sessions introduced in July 2026. Pre-market sessions from 7:30 AM ET exhibit different liquidity profiles than regular hours. Traders must maintain professional caution. The tool assists in mitigating ratio-drift risk but doesn’t eliminate the necessity of user verification. Reliability stems from data frequency and mathematical objectivity.
The July 1, 2026 Cboe ORF model shift impacts the cost basis of complex instruments. This change influences the speed at which the SPX:SPY ratio stabilizes following a volatility event. Continuous monitoring ensures that conversion accuracy persists as global trading hours volume increases. The converter remains functional across all session phases, providing a transparent layer between the user and variable market data. Maintaining 6-second refresh cycles is the only method to prevent technical failures during terminal session volatility.
Optimizing Strike Mapping Execution
Precision strike mapping requires accounting for the realized 10.0360 baseline. Static 10x multipliers fail during peak spx spy ratio market hours due to tracking error and dividend accrual. High-frequency arbitrage cycles and the June 2026 intraday margin standards necessitate real-time data synchronization. Accuracy in 0DTE environments depends on identifying 0.01 ratio shifts that invalidate strike status. Traders must eliminate manual conversion lag to maintain execution efficiency during terminal session volatility.
The system provides a dedicated single-purpose utility for day traders. It features 6-second refresh intervals and live ratio tracking to mitigate slippage. This free technical utility reduces cognitive load during fast market moves. Verified data refresh frequencies are mandatory for maintaining synchronization between the index and the ETF. Implementation of real-time mapping ensures that SPX strikes convert to the correct SPY equivalent status without manual error. Precision remains the primary variable for risk management.
Access the Real-Time SPX to SPY Converter to ensure strike mapping accuracy. Maintain objective execution standards across all trading sessions. Accuracy is the only defense against ratio drift.
Frequently Asked Questions
What is the standard SPX to SPY ratio?
The realized SPX to SPY ratio is 10.0360 as of July 2026. While 10.00 remains the theoretical benchmark, management fees and tracking errors prevent the ratio from reaching this integer in live environments. Traders must utilize the current spot ratio for precise mapping. Relying on static 10x multipliers during spx spy ratio market hours results in strike price selection errors and execution slippage.
Does the SPX:SPY ratio change during market hours?
Yes, the ratio fluctuates continuously during the trading session. Intraday volatility, arbitrage cycles, and liquidity depth cause the SPX:SPY relationship to drift from its opening baseline. Data confirms that 62% of session extremes occur during the first or last hour of trade. These periods of intense activity require high-frequency monitoring to maintain conversion accuracy across divergent asset classes.
Why is the ratio not exactly 10.00?
Structural variables including SPY’s 0.09% expense ratio and dividend accrual prevent a perfect 10.00 correlation. SPY reflects the net asset value of its underlying holdings minus fund expenses. SPX is a price-return index that doesn’t account for cash distributions or management costs. This fundamental divergence ensures the realized ratio remains above the theoretical 10x baseline in nearly all market conditions.
How often should the SPX:SPY ratio be refreshed for day trading?
A 6-second refresh interval is the technical requirement for 0DTE and high-frequency scalping. Market-open volatility between 9:30 AM and 10:00 AM ET averages ±0.25%, making lagging data feeds dangerous. Rapid refresh cycles capture micro-adjustments in the ratio before they impact strike mapping. Professional traders prioritize real-time tracking to mitigate the risk of entering positions at inaccurate price levels.
How do SPY dividends affect the conversion ratio?
SPY dividend distributions reduce the fund’s net asset value relative to the SPX index. This creates a predictable drift in the ratio during ex-dividend weeks. As the SPY price drops to reflect the cash payout, the ratio denominator decreases, causing the total value to spike. Traders must adjust strike expectations during these periods to avoid mapping SPX targets to the wrong SPY contract legs.
Is the SPX:SPY ratio the same in pre-market trading?
No, the ratio exhibits wider fluctuations during pre-market sessions due to low liquidity and expanded bid-ask spreads. Extended trading hours sessions, including the 7:30 AM ET pre-market window, lack the arbitrage efficiency of regular hours. This leads to increased ratio instability. Precise mapping is more difficult outside of the 9:30 AM to 4:00 PM ET window when participant volume is highest.
Can I use the ratio to trade 0DTE options on Robinhood?
Yes, utilizing a real-time ratio is essential for mapping SPX price targets to SPY strikes on the Robinhood platform. Since Robinhood doesn’t provide native SPX/SPY conversion tools, traders must use independent utilities to ensure strike accuracy. This is critical under the June 2026 intraday margin standards, where account minimums are $2,000 and execution precision is vital for capital preservation.
What is the most accurate way to convert SPX strikes to SPY?
The most accurate method is using a dedicated real-time converter with 6-second data refresh intervals. Manual calculations or static spreadsheets fail to account for intraday ratio drift. Professional-grade utilities process the live spx spy ratio market hours baseline to provide exact strike equivalents. This ensures that 0DTE strategies remain aligned with the realized spot price rather than outdated theoretical integers.