The 10:1 multiplier for SPX to SPY strike conversion is a mathematical abstraction. It is not a trading reality. Execution errors and tracking error confusion result from relying on static constants. You face inaccurate strike price mapping and slippage when ignoring spx spy ratio volatility. This technical reference provides the mathematical breakdown for precise strike price conversion. It analyzes the relationship between the S&P 500 Index and the SPY ETF. The 0.0945% SPY expense ratio and the 1.075% index dividend yield drive persistent ratio drift. This guide examines ratio variance, tracking error mechanics, and historical drift patterns to improve mapping accuracy.
Precise execution requires accounting for the 2026 average deviation from the theoretical 10.000 ratio. Dividend yields hit a historical low of 1.08% in May 2026; however, the cumulative effect of the SPY expense ratio continues to create a performance drag relative to the frictionless index. We break down the quarterly gap cycles and the impact of American-style versus European-style exercise on price parity. This analysis ensures you minimize slippage by treating the ratio as a dynamic variable rather than a fixed multiplier. The following data points establish the baseline for high-precision cross-instrument strategies.
Key Takeaways
- Identify structural divergence driven by expense ratios and dividend yields.
- Monitor spx spy ratio volatility during peak market hours for mapping precision.
- Calculate the delta between theoretical 10:1 multipliers and live market values.
- Utilize 6-second refresh intervals to minimize tracking error slippage.
- Review 10-year historical variance to establish baseline ratio expectations.
Understanding the SPX:SPY Price Relationship
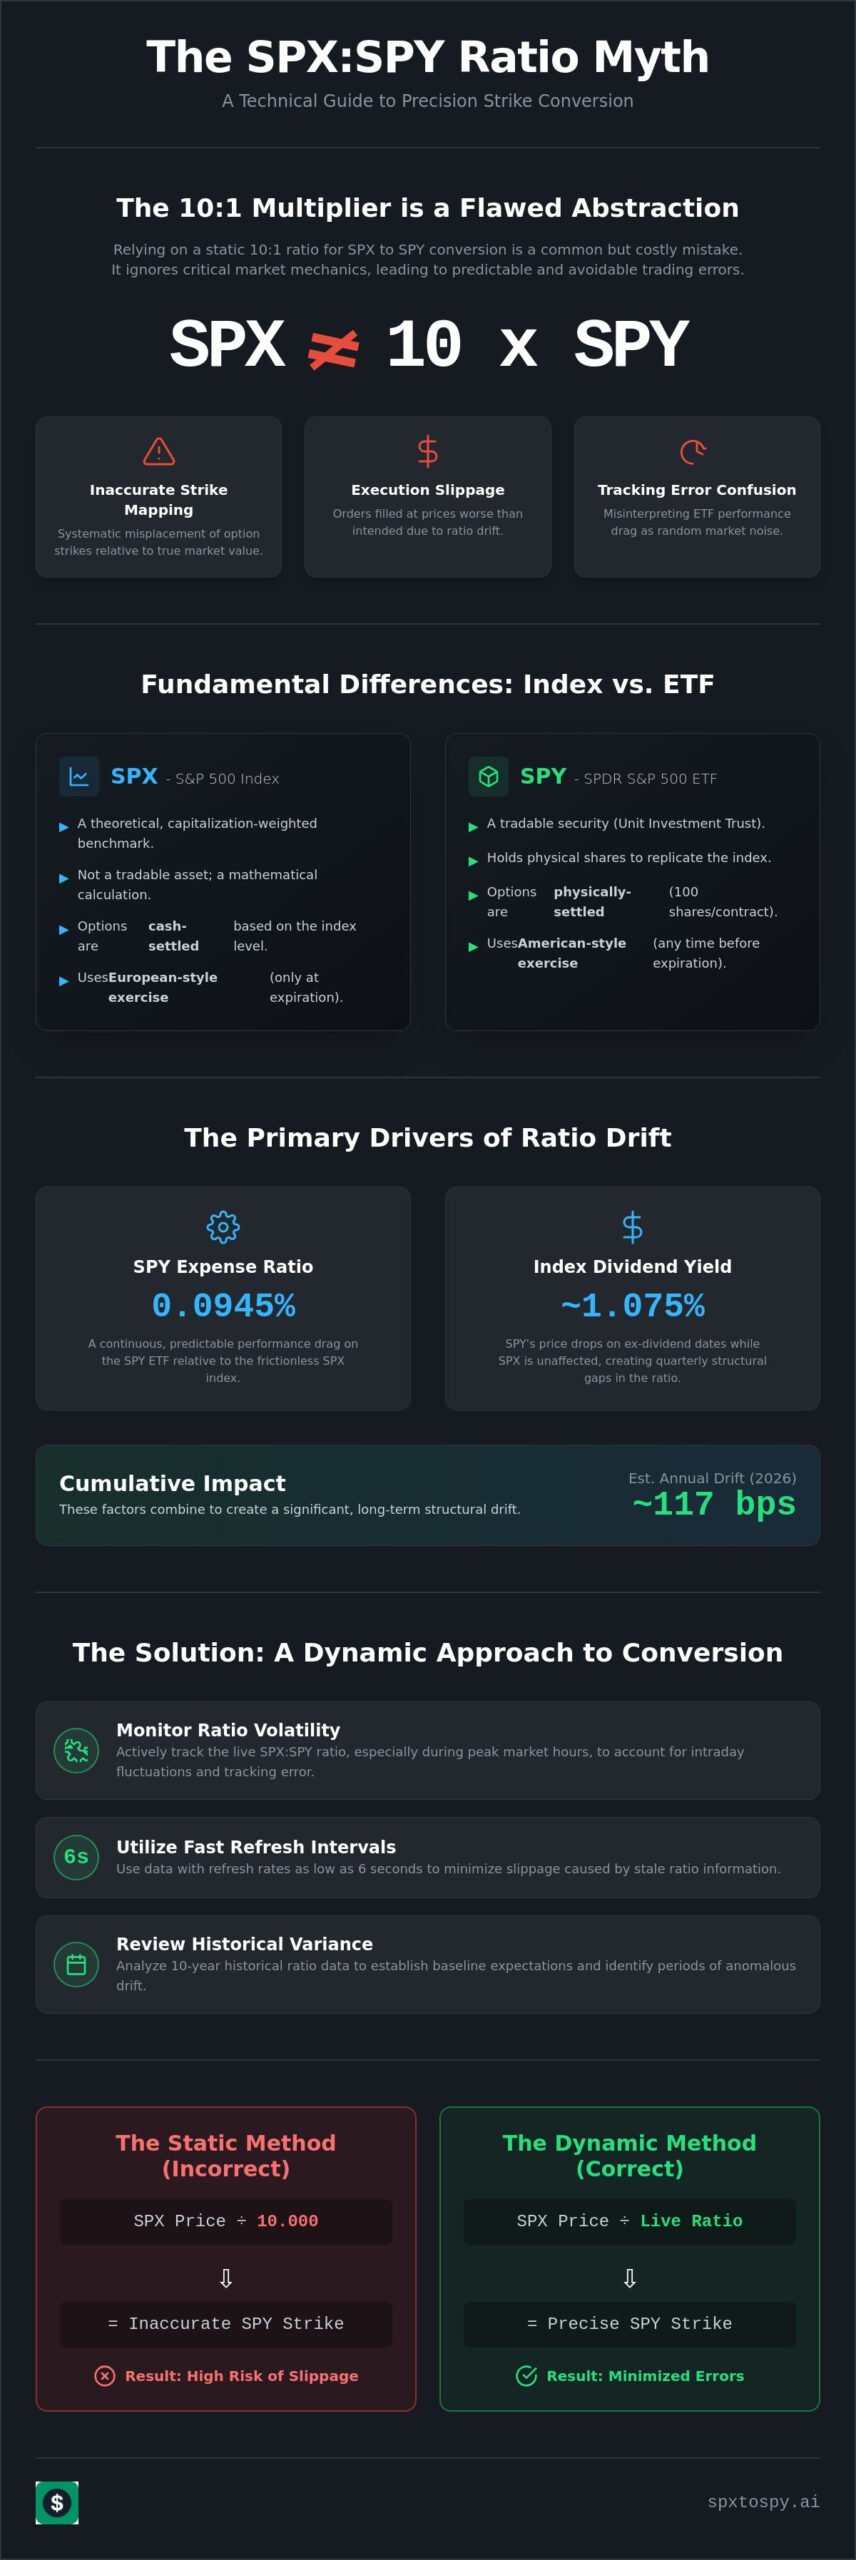
The S&P 500 Index (SPX) functions as a theoretical, capitalization-weighted benchmark. It tracks 500 large-cap U.S. equities. It’s a calculation, not a tradable asset. The SPDR S&P 500 ETF Trust (SPY) is a tradable security. It’s a unit investment trust that holds physical shares to replicate index performance. Distinction is critical. Many platforms erroneously list SPX Corporation (SPXC) when users search for index data. This leads to fundamental mapping failures. Traders must distinguish between the index benchmark and the ETF vehicle to manage spx spy ratio volatility effectively.
Index vs. ETF Mechanics
SPX is a cash-settled index. It has no underlying shares. Settlement is a financial transaction based on the index level at expiration. It avoids the complexities of physical stock transfers. SPY is physically settled. Each options contract represents 100 shares of the ETF. Exercise results in the actual exchange of equity. SPX options use European-style exercise; they can’t be exercised before the expiration date. SPY options use American-style exercise. They allow exercise at any time. This mechanical divergence creates price friction. It influences the dynamic relationship between the two instruments during high-volume sessions. Understanding the full SPX vs SPY settlement difference is essential for traders managing exercise risk and avoiding unintended assignment on physically delivered contracts.
The 10x Multiplier Baseline
The 10:1 ratio is a historical convention. It assumes SPY is valued at exactly 10% of the SPX level. This baseline simplifies strike price standardization across different option chains. It’s a mathematical convenience, not a fixed law. Market conditions frequently break this parity. The 0.0945% SPY expense ratio creates a continuous performance drag. Dividend distributions further reduce the ETF price relative to the frictionless index. Relying on a static 10x multiplier for strike mapping causes execution slippage. It leads to inaccurate delta hedging and spread construction. Traders managing options positions must understand the spx spy ratio effect on options greeks to accurately normalize delta, gamma, and vega values across both instruments when the actual ratio deviates from the theoretical 10.000 baseline.
Execution and Ratio Monitoring
Precise strike mapping is mandatory for 0DTE strategies and cross-instrument hedging. Traders use the live ratio to convert SPX price levels into SPY equivalents. This process accounts for current spx spy ratio volatility and intraday tracking error. Inaccurate mapping results in “ratio drift” execution errors. These errors misplace orders and increase total transaction costs through slippage. Monitoring the live conversion prevents these discrepancies. It ensures that strike selection reflects actual market pricing rather than outdated theoretical models. Real-time tracking remains the only reliable method to maintain high-precision mapping during volatile trading sessions.
Historical Ratio Drift: Why 10:1 is Not Constant
The 10:1 multiplier is a theoretical target. It is not a persistent state. Over a 10-year observation period, the SPX:SPY ratio has exhibited consistent structural drift. This divergence occurs because the index is a mathematical calculation while the ETF is a physical fund with operational costs. In 2026, the cumulative drift is quantified at approximately 117 basis points annually. This figure accounts for the 0.0945% gross expense ratio and the 1.075% average dividend yield. Traders who ignore spx spy ratio volatility face systemic strike mapping errors. These errors compound over time; they result in significant slippage during cross-instrument execution.
Dividend Drag and NAV Calculations
Dividends represent the primary driver of ratio variance. SPY is a unit investment trust. When underlying companies pay dividends, the cash is collected by the trust and later distributed to shareholders. On the ex-dividend date, the SPY share price drops by the dividend amount. The SPX index does not adjust for these cash outflows. It remains a price-return benchmark. This creates a permanent gap in the 10:1 relationship four times per year. Net Asset Value (NAV) calculations reflect the fund’s internal holdings; however, market prices for SPY can deviate from NAV due to supply and demand imbalances.
Tracking Error and Liquidity Premiums
Tracking error and liquidity premiums further complicate the conversion. Tracking error in the context of the SPX:SPY ratio is the divergence between the ETF’s price performance and the underlying index’s movement after accounting for fees. State Street Global Advisors incurs operational costs to maintain the fund. These costs create a constant drag. During periods of high market stress, SPY may trade at a premium or discount to its NAV. This intraday volatility forces the ratio away from its historical mean. Traders can use live market ratio tracking to identify these deviations in real-time.
Interest rates also impact the forward price of SPY. Higher rates increase the cost of carry for market makers hedging SPX options with SPY shares. This cost is priced into the option premiums and the underlying ETF’s forward curve. For precise settlement data, refer to the Cboe SPX Contract Specifications. Understanding these variables is essential for 0DTE traders. They must map SPX levels to SPY strikes with high precision. Static multipliers fail to account for the dynamic nature of fund mechanics and market liquidity.
Intraday Volatility and Ratio Refresh Frequency
Intraday spx spy ratio volatility fluctuates during spx spy ratio market hours. Static multipliers don’t work. The ratio is a live variable; it reacts to liquidity shifts and order flow imbalances. Correlation with the Cboe Volatility Index (VIX) is positive. Rising VIX levels expand the spread between SPX index values and SPY market prices. This divergence complicates strike mapping for high-frequency traders. Precision requires constant monitoring to avoid execution errors. Stale data results in inaccurate strike selection and increased slippage.
Market Open vs. Market Close Dynamics
Price discovery at the opening bell creates initial ratio instability. Market makers adjust quotes based on overnight futures activity. Opening imbalances trigger rapid ratio shifts. Mid-day sessions typically exhibit mean reversion as liquidity stabilizes and volume tapers. The closing auction introduces renewed variance. ETF rebalancing and institutional hedging at the 4:00 PM ET close impact SPY pricing independently of the SPX index calculation. These events trigger ratio drift that standard broker feeds often fail to capture in real-time.
High-Frequency Data Requirements
Standard broker data feeds provide insufficient update frequencies. Many platforms refresh index levels every 15 to 60 seconds. This latency creates mapping gaps. A dedicated spx spy ratio refresh is mandatory for 0DTE execution. 0DTE strategies rely on narrow delta ranges. Even minor ratio delays result in selecting the wrong strike price. This leads to immediate slippage. It reduces the expected value (EV) of the trade. Rapid updates ensure the trader operates on current market data rather than stale prints.
Professional precision requires a 6-second refresh threshold. This frequency aligns with rapid intraday shifts. Computational logic must ingest live SPX prints and SPY bid/ask midpoints simultaneously. Latency exceeding 10 seconds invalidates strike mapping in high-volatility environments. Real-time conversion tools bridge the gap between theoretical index levels and tradable ETF strikes. They ensure execution occurs at the actual market ratio. This minimizes tracking error during fast-moving tape conditions. High-frequency monitoring is the only way to maintain accuracy when spx spy ratio volatility spikes.
Technical limitations of standard feeds include data throttling and delayed index calculations. Most retail brokers prioritize order execution over data refresh rates. This prioritization creates a disadvantage for traders managing cross-instrument spreads. Accurate strike mapping requires a dedicated data stream focused on the mathematical relationship between the index and the ETF. Without this focus, traders rely on approximations that fail during peak volatility. Real-time ratio tracking eliminates the guesswork from strike price conversion.
Strategic Application: Mapping SPX Strikes to SPY
Mapping SPX strikes to SPY equivalents requires a systematic protocol. Theoretical 10:1 multipliers provide a baseline. Market reality dictates a dynamic adjustment. Calculate the delta between the theoretical ratio and the live value to identify the correct strike. SPX options typically exhibit wider bid-ask spreads than SPY. This spread difference impacts net credit and debit calculations. Traders must account for spx spy ratio volatility to maintain hedge effectiveness. Utilizing the SPX to SPY Converter ensures execution logic remains aligned with current market conditions.
0DTE Strike Selection Logic
Pin risk is a primary differentiator. SPX is cash-settled. It eliminates the risk of physical delivery at expiration. SPY is physically settled. Holding SPY strikes near the money (ATM) into the close introduces assignment risk. Mapping SPX credit spreads to SPY requires precise strike parity. Failure to align strikes results in skewed risk-reward profiles. Improper strike mapping in high-delta trades causes catastrophic delta-neutrality failure and unintended directional exposure. Precision mapping preserves the integrity of the original trade thesis during rapid price action. Traders should review the detailed SPX vs SPY settlement difference technical comparison to fully understand how cash settlement versus physical delivery affects pin risk management and margin requirements at expiration.
Arbitrage and Mean Reversion Protocols
Intraday deviations from the 10.000 baseline offer tactical opportunities. In 2026, the average deviation from the 10.000 ratio remains a key metric for mean reversion strategies. Statistical significance occurs when the ratio moves beyond two standard deviations of its 5-day moving average. Execution workflows for multi-leg cross-instrument strategies must incorporate live ratio updates. This prevents leg-in slippage. It ensures the spread captures the intended volatility premium rather than ratio noise. Multi-leg strategies, such as iron condors, require simultaneous mapping across four distinct strikes to maintain balanced risk.
Traders managing high-frequency accounts require immediate data. Access the SPX to SPY Converter to eliminate manual calculation errors. Intraday spx spy ratio volatility creates ghost strikes. These are strikes that appear attractive on a static 10:1 basis but are mathematically incorrect. Correcting for the 2026 average deviation ensures that SPY strike selection mirrors the SPX price action. This is critical for 0DTE iron condors and vertical spreads. Monitoring the ratio delta allows for the adjustment of limit orders to reflect actual parity. This reduces the time-to-fill and improves the overall quality of trade execution. High-precision mapping is the only defense against structural ratio drift.
Precision Tooling for SPX to SPY Conversion
The spxtospy.ai utility functions as a dedicated strike mapping engine. It addresses the systemic drift caused by spx spy ratio volatility. This tool provides a real-time bridge between the SPX index level and tradable SPY strikes. It eliminates the latency inherent in manual calculation. Active traders require this level of precision to maintain delta neutrality. The system is designed for rapid data ingestion and immediate output. It serves as a transparent data layer for 0DTE and cross-instrument execution.
Real-Time Ratio Refresh Architecture
Data integrity relies on a 6-second refresh interval. This frequency captures intraday fluctuations that standard 15-second or 60-second feeds miss. During periods of peak market volume, the architecture maintains stability. It processes live SPX prints and SPY bid/ask midpoints simultaneously. The UI is minimalist. It lacks peripheral market commentary or visual clutter. This design ensures zero-distraction for traders operating in high-pressure environments. The 6-second threshold is the technical requirement for minimizing tracking error during periods of high spx spy ratio volatility.
Strike Price Mapping Utility
The utility automates the conversion of SPX puts and calls to their SPY equivalents. It accounts for the 2026 average deviation from the theoretical 10.000 ratio. Rounding logic is applied to handle fractional strike differences. SPY strikes often trade in $1 increments, while SPX offers finer granularity. The tool identifies the closest liquid SPY strike to the target SPX delta. This prevents selection errors during fast-moving tape. It ensures that the execution strike reflects the actual market ratio rather than a static approximation.
Verification protocols remain a user responsibility. While the tool provides high-precision data, traders must cross-reference outputs with their primary broker platforms before execution. Live Market Ratio Tracking is a diagnostic aid. It’s not a direct trading interface. spxtospy.ai does not offer direct trade execution or financial advisory services. Users must verify all strike mapping against live order books. This dual-verification protocol maintains a risk-aware stance. It balances the speed of the data with the necessity of manual confirmation.
Operationalizing Ratio Variance for Execution
Structural drift and dividend drag invalidate the theoretical 10:1 multiplier. Precise execution requires accounting for the 117 basis point annual deviation observed in 2026. Managing spx spy ratio volatility requires transition from static multipliers to real-time data streams. High-frequency 0DTE strategies demand mapping accuracy to prevent leg-in slippage and delta neutrality failure. Stale broker data feeds create systemic disadvantages during peak volume sessions. These lags compromise the integrity of iron condors and vertical spreads. Accuracy is the only defense against structural tracking error.
Efficiency depends on technical precision. The spxtospy.ai platform provides a clinical, data-centric interface for active traders. The system maintains high-precision mapping through a 6-second refresh rate. This frequency ensures strike selection reflects current market parity. Use this utility to synchronize SPX index levels with tradable SPY strikes instantly. Access the Real-Time SPX to SPY Converter to stabilize your strike selection protocols. Maintain rigorous verification standards for all cross-instrument trades. Success relies on the quality of your data inputs.
Frequently Asked Questions
What is the current SPX to SPY ratio in 2026?
The 2026 ratio deviates from the 10.000 baseline by approximately 117 basis points annually. This variance stems from the 1.075% index dividend yield and the 0.0945% ETF expense ratio. Traders must use live conversion to identify the exact multiplier for current market conditions. Static 10:1 assumptions result in execution errors.
Why is the SPX to SPY ratio not exactly 10 to 1?
Mechanical differences prevent a fixed 10:1 relationship. SPY is a unit investment trust with a 0.0945% gross expense ratio. It incurs tracking error and management fees. SPX is a frictionless index calculation. Dividend distributions from SPY holdings lower the ETF share price while the index remains unaffected.
How does the live SPX SPY ratio affect 0DTE options trading?
Live spx spy ratio volatility dictates strike selection for 0DTE strategies. Inaccurate mapping results in choosing the wrong contract delta. This causes immediate slippage and execution errors. Traders must synchronize SPX levels with SPY strikes using high-frequency data to maintain hedge integrity and delta neutrality. Understanding the precise spx spy ratio effect on options greeks is critical for accurately adjusting delta and gamma exposures when the live ratio diverges from the theoretical 10.000 multiplier during fast-moving 0DTE sessions.
Is SPY always 1/10th the price of the S&P 500 Index?
No, SPY is not a fixed 1/10th fraction of the index. The 10:1 multiplier is a mathematical simplification. Structural drift, tracking error, and dividend drag cause the actual ratio to fluctuate. Relying on the 10.000 constant leads to systemic strike mapping inaccuracies and inaccurate risk assessments.
What causes the intraday drift in the SPX SPY ratio?
Intraday drift results from liquidity imbalances and tracking error. Price discovery at market open and closing auctions creates ratio variance. SPY trades on an exchange based on supply and demand; SPX is a calculated value. This divergence expands during high-volatility sessions when ETF market prices deviate from Net Asset Value (NAV).
How often should the SPX to SPY ratio be refreshed for accuracy?
Refresh intervals of 6 seconds are the technical requirement for professional accuracy. Standard broker feeds often update every 15 to 60 seconds. This latency is unacceptable for 0DTE execution. High-frequency updates ensure strike mapping reflects current market parity rather than stale prints from previous minutes.
Can I use the SPX to SPY ratio to find arbitrage opportunities?
Arbitrage is theoretically possible when the ratio deviates significantly from its 5-day moving average. Execution requires simultaneous multi-leg orders. Retail traders face high execution risk due to latency and wider SPX bid-ask spreads. Most professionals use ratio tracking for strike mapping rather than direct arbitrage strategies.
What is the impact of dividends on the SPY price ratio?
Dividends lower the SPY share price on the ex-dividend date. SPX is a price-return index and doesn’t adjust for these cash outflows. This creates a permanent gap in the 10:1 ratio. The dividend yield for the S&P 500 reached a historical low of 1.08% in May 2026, reducing but not eliminating this structural drag.