The 10:1 trading shortcut is a mathematical inaccuracy that causes systematic slippage in cross-instrument hedging. Most market participants rely on this mental model for SPX and SPY parity, yet they encounter persistent strike mapping misalignment during high-velocity execution. This spx spy 10x ratio explained technical breakdown isolates the specific variables causing ratio drift. It provides the mechanics for precision strike conversion.
You’ll analyze the impact of the 0.0945% SPY expense ratio and the 1.02% dividend yield on price deviation. The analysis covers why the $100 SPX multiplier doesn’t perfectly track 100 shares of SPY over time. We’ll examine the divergence between cash-settled European-style options and physically-delivered American-style contracts. This guide delivers a formula for real-time conversion. It ensures strike price equivalence for 0DTE and day trading strategies. Precise data application eliminates the lag inherent in manual calculations. Use these metrics to execute cross-instrument hedges with mathematical certainty.
Key Takeaways
- Identify the technical origin of the 10:1 benchmark and why historical design intent now conflicts with modern market variables.
- This spx spy 10x ratio explained analysis details how dividend drag and the 0.0945% expense ratio cause constant NAV deviation.
- Map SPX strikes to SPY equivalents by calculating notional value differences across cash-settled and physically-delivered contracts.
- Implement real-time monitoring of SPX spot and SPY midpoints to mitigate slippage in high-velocity 0DTE execution.
- Utilize high-frequency conversion tools with 6-second refresh rates to maintain strike precision during intraday volatility.
The SPX to SPY 10x Ratio: Historical and Technical Foundation
SPX represents the S&P 500 Index. It is a weighted measure of 500 large-cap U.S. equities. SPY is the SPDR S&P 500 ETF Trust. It is a tradable security designed to track that index. State Street launched SPY in 1993 with a specific design intent. The fund was structured to trade at exactly 1/10th the value of the underlying index. This 10:1 relationship simplifies cross-instrument pricing. Traders use this benchmark to compare notional exposure instantly. It serves as the primary reference point for institutional and retail participants alike.
The 10x multiplier remains the industry standard for contract size comparison. One SPX contract controls $100 times the index value. One SPY contract controls 100 shares of the ETF. At a 10:1 ratio, the notional values align perfectly. This spx spy 10x ratio explained analysis highlights why this alignment is no longer a mathematical constant. Modern trading requires dynamic tracking. Static mapping fails in high-frequency environments where micro-deviations impact execution. The shift from manual estimation to algorithmic conversion is a necessity for active traders. Precision matters when slippage occurs at the third decimal point.
Index vs. ETF: Structural Differences
SPX is a theoretical statistical construct. It does not hold assets. SPY is a tradable security that holds a physical portfolio of stocks. This structural gap creates price divergence. SPX options use cash settlement. No shares change hands at expiration. SPY options require physical delivery. Traders receive or deliver ETF shares. Market makers maintain the 10:1 relationship through arbitrage. They buy the ETF and sell index futures or options when the ratio drifts. This activity keeps prices tight. It does not eliminate the inherent deviation caused by the ETF’s internal costs. Management fees and cash drag prevent a permanent 10.000 ratio.
Mathematical Basis of the 10:1 Multiplier
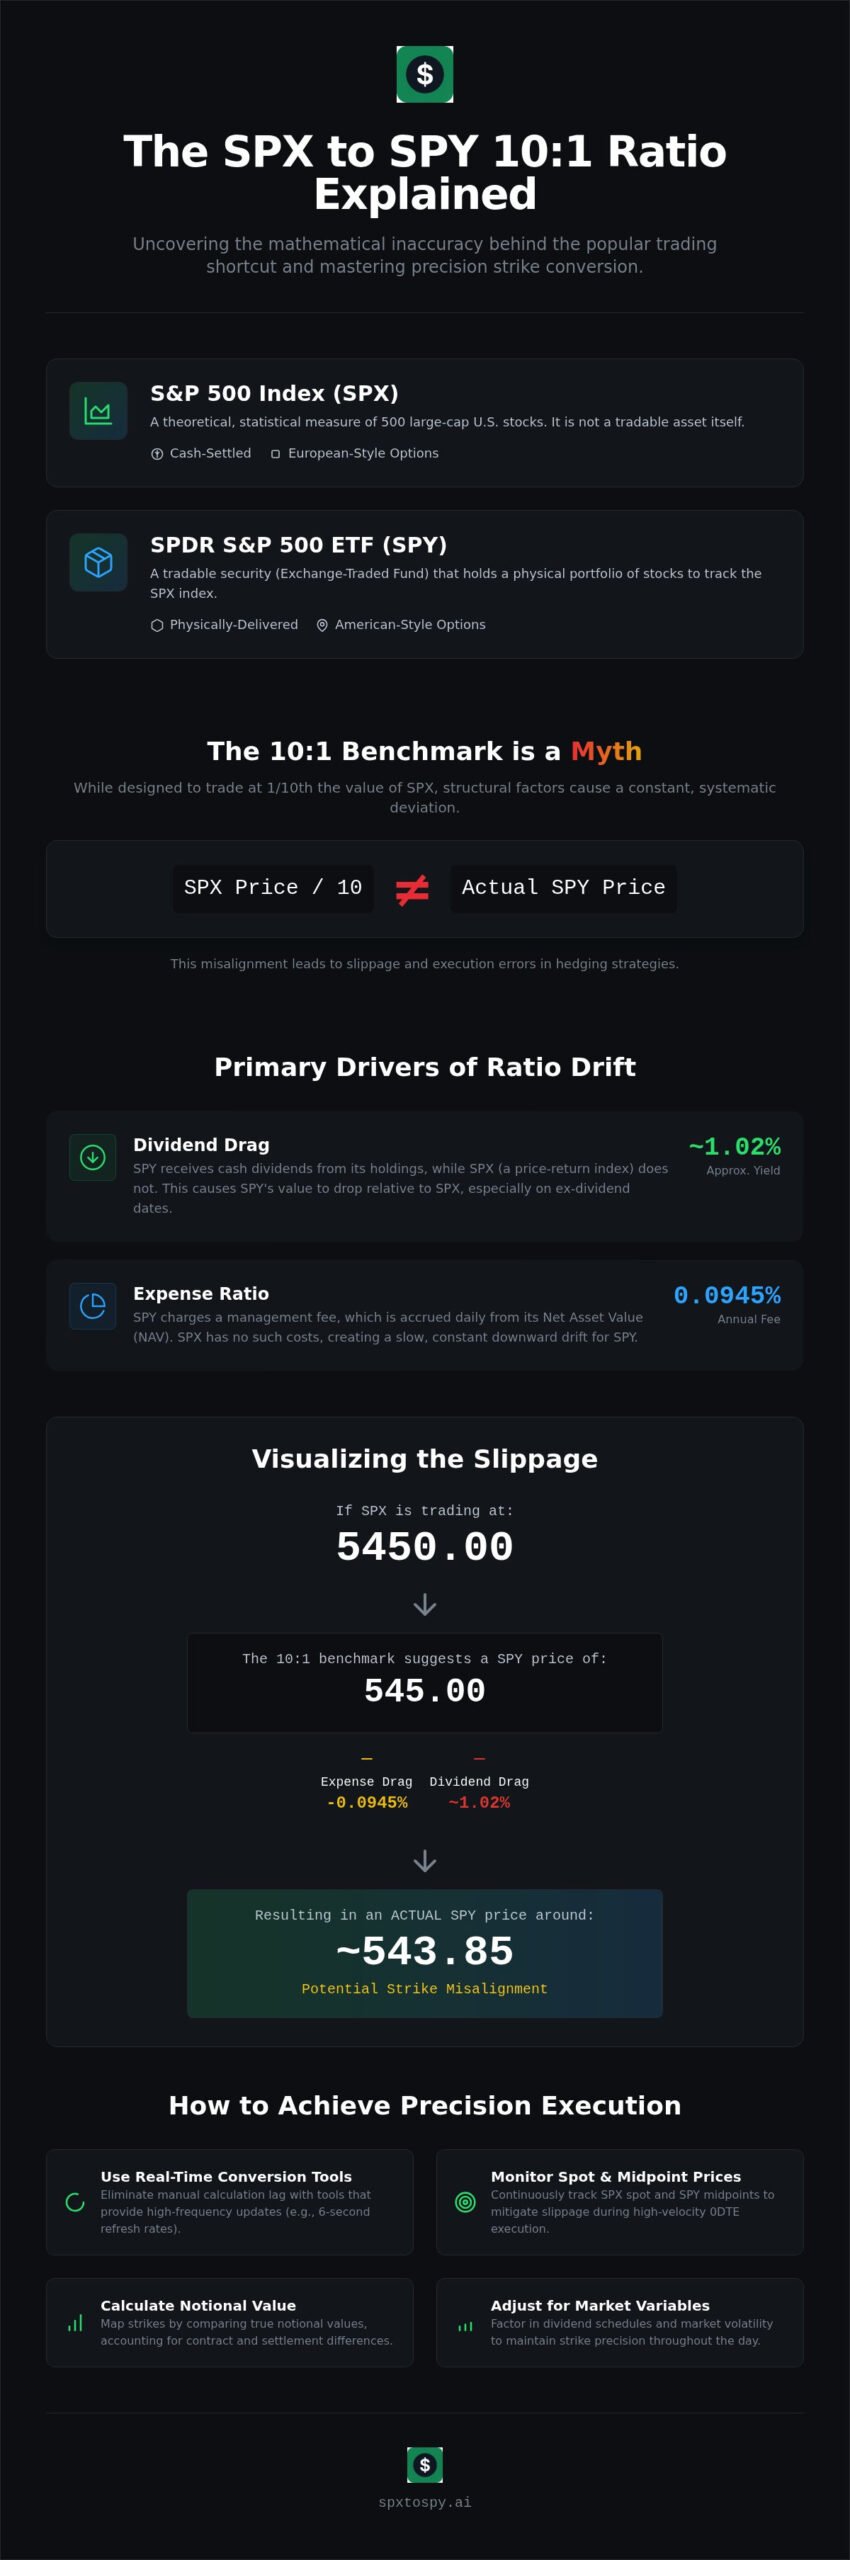
The core calculation is SPX Price / 10 = Theoretical SPY Price. If SPX trades at 5450, the theoretical SPY price is 545.00. Floor traders originally used this for rapid mental strike mapping. It allows for instant conversion between instruments during high volatility. Understanding the spx spy ratio meaning is critical for technical analysis. It reveals the underlying parity or lack thereof. While the 10:1 benchmark is the starting point, technical mechanics like dividend drag and expense ratios force a shift to precision calculation. Relying on the 10x shortcut without real-time adjustment leads to strike price misalignment. This misalignment causes execution errors in complex hedging strategies.
Why the 10:1 Ratio Deviates: Dividend Drag and Expense Ratios
The 10:1 ratio between SPX and SPY is a technical benchmark rather than a mathematical constant. Systematic ratio drift occurs due to three primary variables: dividends, management expenses, and NAV premiums. These factors ensure that SPY rarely trades at exactly 10% of the SPX spot price. This spx spy 10x ratio explained breakdown identifies why static mapping leads to execution errors. Intraday tracking error further complicates parity during high-volatility sessions.
Management fees represent a constant erosion of parity. SPY carries an expense ratio of 0.0945%. This fee is accrued daily and reflected in the fund’s Net Asset Value (NAV). Because SPX is a pure statistical index without management costs, the ETF price slowly lags the index over time. This cumulative effect prevents a permanent 10.000 ratio. Active traders must adjust strike mapping to account for this 0.0945% annual drag to maintain precision. Relying on an outdated 10:1 mental model results in suboptimal entries during 0DTE execution.
The Impact of Cash Dividends on SPY Price
Dividend drag is the most significant driver of ratio deviation. SPX is a price-return index. It tracks the aggregate price of its constituents without accounting for dividend distributions. Conversely, SPY receives cash dividends from its underlying holdings, which currently yield approximately 1.02%. These funds are held in the trust until quarterly distribution. On ex-dividend dates, the SPY NAV drops by the exact amount of the dividend payment. This event causes an immediate price gap between the index and the ETF. Futures traders utilize fair value calculations to quantify this dividend basis. Without these adjustments, strike equivalence calculations fail at the ex-dividend boundary. Understanding the full mechanics of the spx spy price relationship is essential for accurately modeling these dividend-driven divergences and their impact on strike mapping precision.
NAV Premiums and Discounts
SPY trades on the secondary market as a tradable security. Market demand for ETF shares can cause the price to deviate from the underlying Net Asset Value. This creates premiums or discounts. Large-scale institutional order flow often triggers these temporary ratio spikes. While the creation and redemption process limits these gaps, micro-fluctuations persist throughout the trading day. Accurate strike mapping requires a precise spx spy ratio calculation that incorporates live bid/ask midpoints. Monitoring these deviations is essential for high-frequency execution. For traders requiring instant parity data, using a real-time SPX to SPY converter mitigates the risk of manual calculation lag.
SPX vs. SPY Options: Strike Equivalence and Contract Size
Contract notional values define the core relationship between these instruments. SPX notional value equals the index spot price multiplied by a $100 contract multiplier. SPY notional value equals the ETF price multiplied by 100 shares. At a nominal 10:1 ratio, one SPX contract is mathematically equivalent to ten SPY contracts. This spx spy 10x ratio explained framework allows traders to scale exposure across different account sizes. Accurate scaling requires constant monitoring of the ratio to avoid unintended leverage spikes.
An SPX 5400 strike is theoretically equivalent to a SPY 540 strike. This mapping assumes a perfect 10.000 ratio. In live market conditions, SPY often trades at a slight discount to this theoretical value due to the factors identified in previous sections. If SPY trades at 538.50 while SPX is at 5400, the 540 strike is no longer at-the-money. This discrepancy creates friction for traders moving between chains. Mapping errors lead to incorrect delta assumptions and flawed Greeks at the time of entry.
Strike granularity presents a significant execution challenge. SPY options offer $1 strike intervals across the entire chain, providing high precision for narrow-spread strategies. SPX typically offers wider gaps, often $5 or $2.50, depending on the expiration cycle. This mismatch makes exact 1/10th mapping impossible for certain price points. Traders must use an spx to spy converter to identify the nearest liquid strike. Precision mapping is mandatory for 0DTE accuracy where gamma risk is highest.
Notional Value and Leverage Comparison
One SPX contract controls approximately $540,000 in notional value when the index is at 5400. Controlling the same exposure requires 1,000 shares of SPY or 10 SPY option contracts. SPX offers superior capital efficiency through lower aggregate margin requirements. Institutional block trades face significant risk from rounding errors when using the 10x rule. A ratio deviation of 0.05 shifts notional exposure by $2,700 per SPX contract. This variance impacts P&L volatility and requires precise position sizing adjustments during high-velocity market moves.
Strike Mapping for Hedging Strategies
Delta-hedging SPX positions with SPY options requires exact contract counts based on the live ratio. If the ratio drifts to 10.05, hedging one SPX unit requires 10.05 SPY contracts. Traders must round to the nearest whole contract, which leaves a residual delta. This “hedge leak” accumulates in large portfolios. The current ratio determines the exact number of SPY contracts needed to offset index-level risk. Strike equivalence is technically defined by the 10.03x historical average. This specific metric accounts for the long-term impact of dividend distributions and management fees on the ETF price.
Real-Time Ratio Calculation for Intraday Mapping
Dividing by 10 is a retail-level approximation. It is insufficient for high-frequency or 0DTE trading environments. A ratio drift of 0.05 points shifts the SPY equivalent by 50 cents when the index is at the 5000 level. This spx spy 10x ratio explained guide prioritizes technical precision over mental shortcuts. Manual rounding errors during fast market conditions cause systematic execution failure. Traders must adopt a three-step calculation protocol to maintain strike parity.
- Step 1: Capture the live SPX spot price and the live SPY bid/ask midpoint. Using the midpoint eliminates the bid-ask bias inherent in wide spreads during high volatility.
- Step 2: Calculate the specific ratio using the formula: SPX Spot / SPY Midpoint. Carry this value to four decimal places for maximum strike mapping accuracy.
- Step 3: Apply the derived ratio to the target SPX strike. This identifies the precision SPY strike equivalent for the current micro-session.
Automated tracking reduces calculation latency. Many professional desks implement the spx spy ratio thinkorswim script for continuous monitoring. This script visualizes the ratio as a live study on the price chart. It allows for instant visual verification of strike alignment without manual data entry. Precision mapping is the only way to mitigate the tracking error discussed in previous sections. For instant strike mapping, use the real-time SPX to SPY converter to ensure data currentness.
The 6-Second Refresh Requirement
Stale data leads to “Ghost Strikes.” These are price targets based on a ratio that no longer exists in the live order book. Ratio volatility is highest during the market open and the final 30 minutes of the trading session. Execution errors occur when traders enter orders based on minute-old data. Traders should maintain a protocol for verifying strikes with a broker before final order entry. A six-second refresh rate provides the necessary granularity for 0DTE scalping. This frequency matches the pulse of institutional data feeds and prevents slippage.
0DTE Scalping Precision
Mapping SPX “Pin” risk to SPY price levels requires sub-penny accuracy. Small ratio shifts change the Out-of-the-Money (OTM) status of a strike instantly. A 540 strike that appears OTM based on a 10.00 ratio may be at-the-money if the ratio shifts to 10.05. This shift impacts the delta and gamma profile of the position. Ratio Delta is the measurement of the change in the SPX:SPY relationship over a single trading session. Tracking this delta prevents traders from holding positions that have technically crossed the strike threshold due to ratio drift rather than index movement.
Precision Execution: Utilizing Real-Time Conversion Tools
Execution precision requires more than theoretical knowledge. Manual calculation introduces latency that active traders cannot afford. The spxtospy.ai real-time utility serves as the primary interface for professional conversion. This spx spy 10x ratio explained technical summary identifies the drivers of ratio drift; the real-time converter resolves those deviations programmatically. It eliminates the need for mental arithmetic during rapid market shifts. Automated mapping reduces cognitive load. This allow traders to focus on order flow rather than strike arithmetic. Speed is the priority in 0DTE environments where gamma risk is extreme.
Tool Specifications and Features
The system provides a dedicated real-time SPX to SPY strike price conversion interface. Data refreshes every six seconds to maintain parity with institutional market feeds. This frequency is essential for capturing the micro-adjustments caused by the 0.0945% expense ratio and intraday tracking error. The tool delivers high decimal precision for strike mapping. It accounts for the current 1.02% dividend yield impact on the ETF price. Key features include:
- Real-time conversion updated every six seconds for active market monitoring.
- High-precision ratio tracking to four decimal places.
- Mobile-responsive design for traders utilizing multi-device setups.
- Simplified UI focused on strike price equivalence without data clutter.
The interface is designed for rapid scanning. It presents data in a modular fashion to support instant decision-making. Mobile responsiveness ensures that traders can monitor the ratio on secondary devices while primary monitors remain dedicated to order books and charts. This technical setup enhances situational awareness during high-velocity sessions.
Workflow Integration for Day Traders
Professional workflows integrate the converter alongside execution platforms like Thinkorswim or Robinhood. During high-volatility events like FOMC or CPI releases, execution lag must be minimized. Stale data results in fills at incorrect strikes. The converter provides the immediate parity needed for strike selection. It bridges the gap between index movement and ETF pricing. Traders should use the tool to identify the target strike then confirm the bid/ask spread on their brokerage platform. This dual-verification protocol manages execution risk. It ensures that the selected strike is at-the-money based on the most current data available.
Access the specific mapping data required for precision trading. Access the Real-Time SPX to SPY Converter Now. Always verify final strike selection with live broker data before order transmission. Market conditions fluctuate faster than third-party feeds. Reliability depends on user verification and data currentness. This risk-aware stance balances speed with the necessity of mathematical accuracy.
Precision Strike Mapping for Active Execution
The technical reality of the spx spy 10x ratio explained in this analysis confirms that static mental shortcuts are insufficient for professional execution. Systematic drift from dividends and expense ratios ensures that the 10:1 benchmark remains a moving target. Precision mapping requires live data inputs to resolve tracking errors and mitigate gamma risk. 0DTE traders must utilize high-frequency updates to maintain strike parity during intraday volatility. Reliance on outdated parity models results in execution errors at critical price levels.
Adopt a data-centric approach to cross-instrument hedging. Use this free technical utility to eliminate calculation latency and execution slippage. The platform delivers precision mapping for 0DTE traders by incorporating the latest bid/ask midpoints. Access live market ratio tracking with data refreshed every six seconds for maximum accuracy. Convert SPX Strikes to SPY in Real-Time and execute with mathematical certainty. Verify all strikes with your broker to ensure final alignment before order transmission. Maintain execution discipline through reliable data streams.
Frequently Asked Questions
What is the current SPX to SPY ratio today?
The current ratio fluctuates in real-time based on the live SPX spot price and SPY midpoint. While 10.00 is the historical design benchmark, active sessions often see ratios drifting between 10.02 and 10.05. Traders must use live tracking tools to identify the exact value at the time of execution. Static estimates lead to systematic mapping errors during high-velocity price action.
Why is SPY not exactly 1/10th of the S&P 500 Index?
Structural costs and dividend distributions cause persistent deviation. SPY is a tradable security with a 0.0945% expense ratio and a current 1.02% dividend yield, whereas SPX is a theoretical price-return index. These variables erode the 10:1 parity over time. Management fees and cash drag ensure the ETF NAV rarely maintains a perfect 10.000 multiplier during live market hours.
How do I convert an SPX strike price to a SPY strike price?
Divide the target SPX strike by the live SPX:SPY ratio to identify the equivalent SPY strike price. This spx spy 10x ratio explained protocol requires using a four-decimal ratio rather than the 10.00 retail shortcut. Precision mapping prevents entering orders at strikes that are technically misaligned due to ratio drift. Accurate conversion is mandatory for maintaining delta neutrality in cross-instrument hedging strategies.
Does the SPX SPY ratio change during market hours?
The ratio is dynamic and shifts with intraday volatility and market maker activity. Fluctuations typically peak during the market open and the final 30 minutes of the session as premiums and discounts adjust. These micro-movements can shift the ratio by several basis points within seconds. Continuous monitoring is required to capture these changes and ensure strike price equivalence remains valid throughout the trading day.
Why does the 10x ratio matter for 0DTE options traders?
The ratio determines strike parity and gamma exposure for short-dated contracts. Small calculation errors lead to ghost strikes where the perceived at-the-money level is mathematically incorrect. 0DTE traders require sub-penny accuracy to manage the rapid delta shifts associated with expiration. Precision mapping ensures that scalps and hedges align with the actual underlying index level rather than a rounded retail estimate.
What is dividend drag and how does it affect the SPY price?
Dividend drag is the reduction of the ETF price on ex-dividend dates to reflect shareholder distributions. SPX is a price index and does not adjust for these cash payouts. This creates a widening gap between the two instruments. The ratio typically moves above the 10.00 benchmark as the SPY price declines relative to the index to account for the dividend yield.
How often should the SPX SPY ratio be refreshed for accuracy?
A six-second refresh rate is the institutional standard for maintaining strike accuracy. Stale data results in execution slippage and mapping errors during volatile sessions. Refreshing the ratio at this frequency captures intraday tracking errors and rapid premium shifts. This granularity is essential for 0DTE scalping where price action moves faster than manual calculation or retail data feeds allow.
Can I use the 10x ratio for SPX vs. ES futures conversion?
The 10x ratio is specific to the SPX and SPY relationship and does not apply to ES futures. ES contracts utilize a $50 multiplier and incorporate a fair value basis involving interest rates and time to expiration. Converting between SPX and ES requires a separate calculation that accounts for the futures’ premium or discount to the spot index level.