
The 10:1 static multiplier is a mathematical inaccuracy that compounds execution risk. July 2026 data confirms the SPX/SPY ratio at 10.05. This deviation accounts for the 0.0945% SPY expense ratio and dividend drag. You require a functional spx spy ratio thinkorswim formula to eliminate calculation latency during 0DTE sessions. Mapping SPX technical levels to liquid SPY contracts manually increases the probability of strike selection error and slippage. Standard Thinkorswim ratio charts lack the dynamic inputs required for high-frequency strike precision.
This technical implementation provides the logic for automated ratio tracking and strike mapping. You’ll use dynamic cost-of-carry variables within Thinkorswim version 1992 custom studies to achieve functional efficiency. The result is a significant reduction in execution error and improved hedging precision for complex instruments. We’ll detail the specific ThinkScript code and mathematical relationships needed to synchronize cash index levels with ETF price action.
Key Takeaways
- Eliminate calculation latency. Replace static 10:1 approximations with dynamic cost-of-carry variables for 0DTE precision.
- Implement core conversion formula (SPX Target / Live Ratio). Identify exact SPY equivalent strikes with decimal precision.
- Execute spx spy ratio thinkorswim syntax via the Charts tab. Configure Equity display settings for technical accuracy.
- Map SPX support and resistance to liquid SPY contracts. Reduce execution error during high-volatility sessions.
- Bypass manual ThinkScript maintenance. Utilize 6-second refresh intervals for strike mapping reliability.
The SPX:SPY Ratio in Thinkorswim: Beyond the 10:1 Approximation
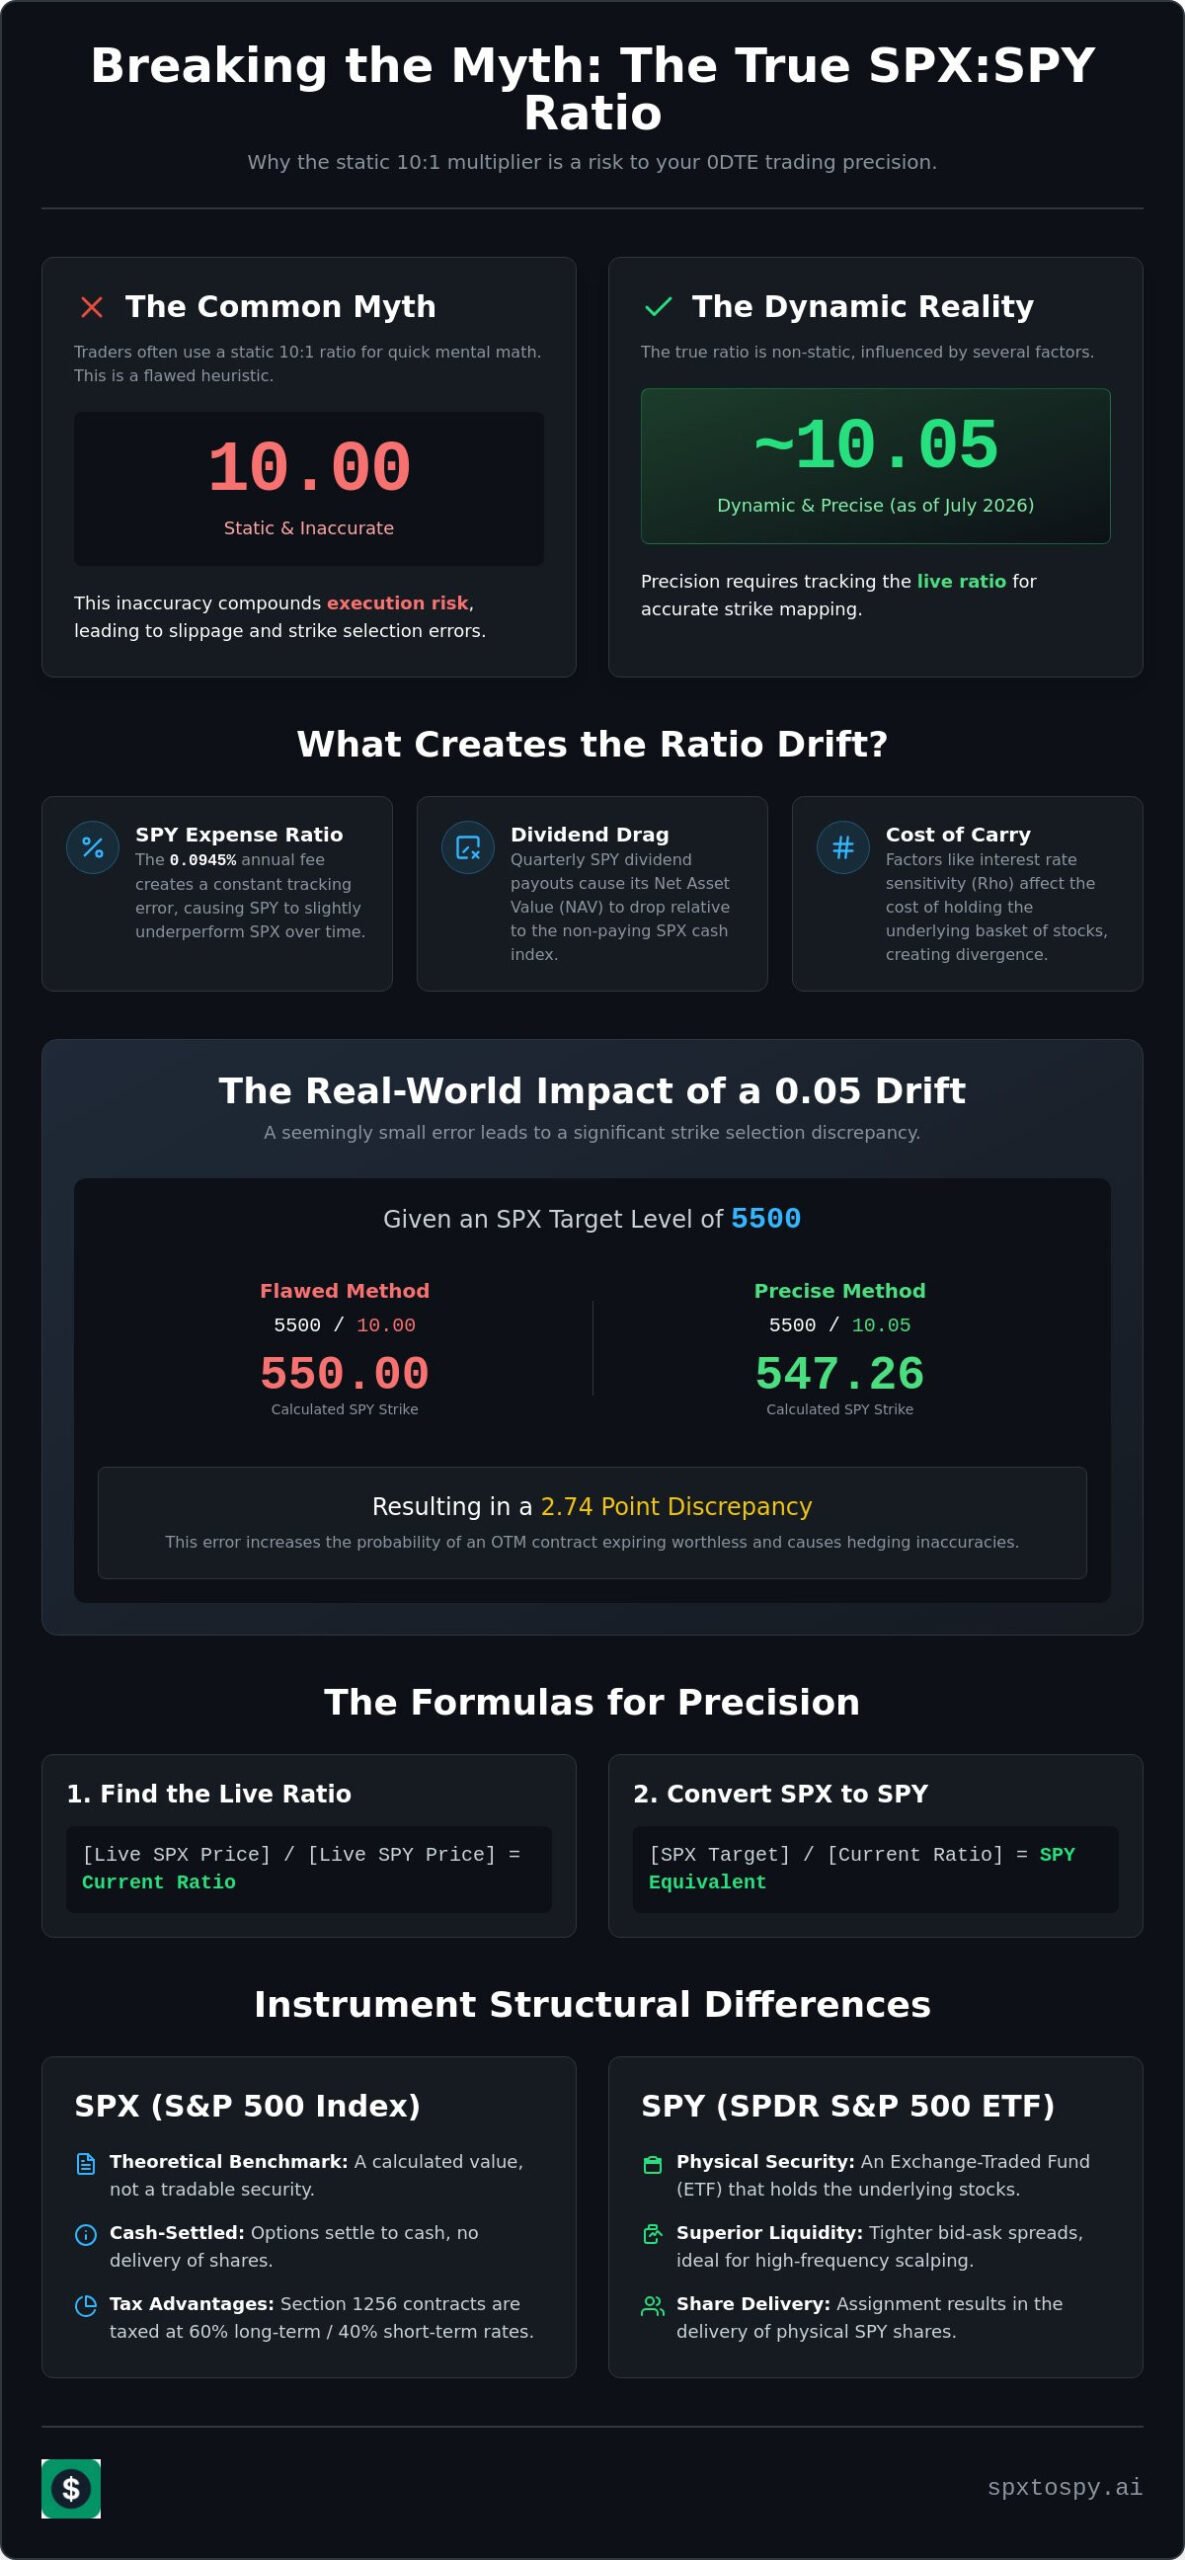
The relationship between the S&P 500 Index (SPX) and its primary exchange-traded fund, the SPDR S&P 500 ETF Trust (SPY), is not a static 10:1 correlation. Traders often rely on the legacy 10x multiplier for rapid mental math. This heuristic is mathematically flawed. It ignores the cumulative impact of tracking error, dividend distributions, and the 0.0945% SPY expense ratio. Effective 0DTE execution requires a precise spx spy ratio thinkorswim calculation to map technical levels to liquid option chains. Reliance on the 10:1 myth leads to strike selection errors. This results in execution slippage and miscalculated delta exposure. Precise mapping is critical for traders moving between the cash index and the more liquid ETF. Understanding the spx spy ratio meaning and its structural drivers is the foundation for eliminating these execution errors.
Index vs ETF Structural Divergence
SPX is a theoretical benchmark. It’s a cash-settled index. It offers specific tax advantages under Section 1256 of the Internal Revenue Code. For the 2026 tax year, gains are taxed at 60% long-term and 40% short-term rates. SPY is a physical security. It requires delivery of shares upon assignment. High-frequency scalpers prioritize SPY for its superior liquidity and tighter bid-ask spreads. The divergence between these two instruments stems from management fees and quarterly dividend payouts. These variables shift the ratio away from the 10.00 integer. As of July 2026, the real-time ratio sits at approximately 10.05. This figure represents the true relationship between the underlying index and the tradeable fund.
The Necessity of Decimal Precision
A ratio drift of 0.01 significantly impacts OTM strike selection. If SPX is at 5500, a 10.00 ratio suggests a 550 SPY strike. A 10.05 ratio places the equivalent level at 547.26. Selecting the 550 strike based on a flawed ratio creates a 2.74 point discrepancy. This error increases the probability of the contract expiring worthless. Intraday traders must maintain four-decimal accuracy to ensure strike mapping reliability. Manual tracking is inefficient during high-volatility events. Automated spx spy ratio thinkorswim scripts reduce computational latency. They provide the necessary precision for 0DTE scalping and complex hedging strategies. Verified data from July 2026 indicates that dynamic tracking is the only method to eliminate mapping inaccuracy. Precise data entry is mandatory for professional risk management. Factors affecting this precision include:
- Tracking Error: Divergence caused by the 0.0945% SPY expense ratio.
- Dividend Drag: Cumulative impact of quarterly payouts on ETF pricing.
- Execution Risk: Slippage resulting from non-precise strike mapping.
Traders must also account for the SEC Section 31 fee of $20.60 per million when calculating net profit on high-notional conversions. Automated tools ensure these technical variables are integrated into the decision-making process without manual calculation delay.
The SPX SPY Ratio Formula: Mathematical and Technical Variables
The spx spy ratio thinkorswim calculation relies on two high-frequency data streams. The core equation is: [Live SPX Price] / [Live SPY Price] = [Current Ratio]. This value is non-static. For precise execution, apply the conversion formula: [SPX Target Level] / [Live Ratio] = [SPY Equivalent Strike]. Technical variables like the cost of carry and Rho influence this relationship. Rho measures sensitivity to interest rate fluctuations. Higher interest rates increase the cost of carry for the underlying basket. This creates a divergence between the cash index and the tradeable ETF. Traders must monitor these variables to maintain strike mapping accuracy during volatile sessions. A rigorous spx spy ratio calculation that accounts for tracking divergence and the SPY Unit Investment Trust structure is essential to avoid mispriced orders during rapid price action.
Tracking error is a constant factor in the SPY Trust. It incurs a 0.0945% annual expense ratio. This fee creates a rebalancing drag. It causes the ETF to underperform the index over time. Review the SPX Options Specifications for settlement details. These specifications define the underlying value used for index-level calculations. Any deviation in rebalancing or management fees expands the ratio. Professional risk management requires accounting for these micro-discrepancies to avoid delta miscalculation. Use mid-point pricing to filter out bid-ask spread noise in the ratio output.
Dividend Drag and Ratio Drift
Ratio expansion is predictable during quarterly SPY ex-dividend cycles. SPY Net Asset Value (NAV) drops relative to SPX during distributions to reflect the cash payout. Historically, the ratio deviates from the 10.00 constant by 0.04 to 0.06 points during these periods. This expansion is not reflected in the SPX cash index. Failure to adjust for this drift results in OTM strike selection errors. Traders often misidentify support levels by several points when using a static 10:1 multiplier during dividend weeks. Precise spx spy ratio thinkorswim tracking accounts for this NAV reduction automatically.
Computational Logic for 0DTE Traders
Mid-point pricing (Bid+Ask/2) is superior to last-price data. Last-price data introduces stale-price bias during low-volume periods. Mid-point pricing reflects current market sentiment. Deep OTM strike mapping requires four significant digits. A two-decimal approximation is insufficient for 0DTE scalping. Accuracy requires high-frequency data updates. A 6-second refresh threshold is mandatory for maintaining decimal integrity. This interval balances data load with execution speed. For traders seeking a real-time ratio tracking solution, automated tools eliminate the latency of manual ThinkScript updates. This ensures the strike price converter remains synchronized with rapid index movements. High-precision data is the primary defense against execution slippage.
Implementing Ratio Charts and Scripts in Thinkorswim
Execute technical implementation by opening the Charts tab. Input the symbol syntax SPX/SPY directly into the symbol box. This command activates the division operator to plot the live relationship between the index and the ETF. Configuring chart settings to Equities mode is mandatory. Standard index settings often truncate decimal values. Equities mode ensures the spx spy ratio thinkorswim output maintains the four-decimal precision required for 0DTE strike mapping. Apply a Comparison study to overlay SPX and SPY price action. This visualization highlights the divergence points caused by dividend drag and expense ratios.
Save this configuration as a dedicated Workspace. High-volatility 0DTE sessions leave no margin for setup latency. A pre-configured workspace allows for instant access to ratio data during market opens. Professional implementation requires the following steps:
- Symbol Input: Type SPX/SPY to generate the ratio line.
- Study Overlay: Add the Comparison study to view price action correlation.
- Precision Toggle: Set chart type to Equities for maximum significant digits.
- Workspace Save: Name the layout “0DTE Ratio” for rapid retrieval.
ThinkScript Syntax for Live Ratio Labels
Custom ThinkScript labels provide real-time monitoring without occupying dedicated chart real estate. Use the following logic to define variables: def spx = close("SPX"); and def spy = close("SPY");. The AddLabel function displays the result. Syntax: AddLabel(yes, spx / spy, Color.WHITE);. You can color-code the label to signal ratio expansion. Use if (spx/spy) > 10.05 then Color.RED else Color.GREEN based on July 2026 benchmark data. This visual feedback facilitates immediate strike price conversion. It eliminates the need for manual calculations during rapid price movements.
Visualizing Correlation and Divergence
Apply the Correlation study to the spx spy ratio thinkorswim chart to identify tracking errors. A correlation value of 1.0 indicates perfect alignment. Deviations below 0.99 signal significant tracking error or dividend-related drift. The ratio typically exhibits intraday mean reversion during standard market hours. Pre-market and after-hours sessions show increased ratio volatility. This occurs because SPY continues trading while the SPX cash index remains static. Monitoring these divergence periods is critical for traders positioning for the opening bell. It ensures that gap-up or gap-down levels are mapped to the correct liquid SPY strikes before the session begins.
Tactical Strike Mapping: Converting SPX Levels to SPY Equivalents
Identifying SPX support and resistance levels is the primary requirement for 0DTE trade planning. Use the live spx spy ratio thinkorswim output to derive SPY equivalents from index-level technical targets. Manual division at a static 10:1 ratio creates a pricing gap of several points on high-notional trades. Execution speed is the deciding factor in high-volatility environments. High-volatility sessions penalize manual calculation delay with increased slippage. Use automated technical studies to maintain synchronization between index levels and ETF strikes. This ensures that entry orders trigger at the exact technical inflection point.
Rounding protocols are mandatory for selecting tradeable strikes. Standard SPY option chains use 1.00 or 0.50 strike increments. When the calculated SPY level falls between strikes, select based on the trade direction. Choose the higher SPY strike for resistance levels to maintain a conservative entry profile. Choose the lower SPY strike for support levels. This systematic approach prevents selecting strikes that are too far out-of-the-money (OTM). It preserves the intended delta and theta characteristics of the position. Precise rounding eliminates the financial cost of strike selection errors during rapid market moves.
0DTE Scalping Protocol
Mapping SPX technical breakouts to SPY call and put chains requires four-decimal accuracy. Scalpers must identify the nearest liquid SPY strike to maintain target delta exposure. Utilize the ratio to execute delta-neutral hedging between the cash index and the ETF. This protocol ensures that technical signals from the cash index translate to tradeable orders in the ETF chain. For automated mapping, utilize the Index Options Strike Price Converter to eliminate manual input error. This tool synchronizes index levels with the tradeable ETF chain instantly.
Slippage Mitigation and Order Entry
Ratio drift impacts the structural integrity of multi-leg strategies. Iron Condors and vertical spreads require precise strike spacing to maintain the risk-reward profile. A 0.05 ratio drift can shift an entire spread away from the intended technical level. Verification protocols demand cross-referencing Thinkorswim data with a secondary utility. Systemic latency in Thinkorswim occasionally leads to stale ratio values during peak volume. Use a Real-Time SPX to SPY Strike Price Converter to confirm the current multiplier before order entry. This redundancy reduces the probability of execution error. Risk management for automated data feeds requires constant validation to ensure decimal integrity remains within the 6-second refresh threshold.
Real-Time Conversion Efficiency with spxtospy.ai
Manual ThinkScript implementations introduce systemic risk. Workstation latency and script syntax errors compromise the spx spy ratio thinkorswim output integrity. Automated solutions eliminate these technical vulnerabilities. The spxtospy.ai platform provides a dedicated environment for real-time strike mapping. It removes the requirement for manual ThinkScript maintenance or coding updates. Users receive a synchronized 6-second ratio refresh. This specific interval ensures maximum decimal precision during rapid 0DTE price discovery. The interface is clinical and zero-fluff. It prioritizes functional data delivery for rapid intraday scanning. This design minimizes cognitive load during high-pressure execution windows.
Direct mapping is the core functional advantage. The system converts SPX index levels to SPY equivalents instantly. It removes the need for manual division or mental heuristics. This process eliminates the probability of rounding errors in fast-moving markets. It ensures that the selected SPY strike aligns exactly with the SPX technical inflection point. Functional efficiency is maximized through the following data points:
- Refresh Rate: Automated 6-second intervals for real-time accuracy.
- Precision: Four-decimal ratio tracking for OTM strike selection.
- Accessibility: Zero-latency interface optimized for high-frequency monitoring.
- Error Mitigation: Elimination of manual calculation and script maintenance.
The spxtospy.ai Advantage for ToS Users
The platform maintains real-time data parity with professional institutional feeds. This ensures the spx spy ratio thinkorswim calculation remains reliable when local platform data lags during peak volume. The utility is mobile-optimized. Traders monitor ratio expansion outside the desktop environment. This redundancy is critical for managing positions during hardware failure or power loss. Review the SPX to SPY Converter Pillar for advanced mapping protocols. Professional-grade tools provide the technical foundation for consistent 0DTE execution.
Operational Protocol and Verification
Use the converter as a secondary confirmation for all Thinkorswim order entries. Technical redundancy is mandatory for institutional-grade risk management. Cross-reference the ToS ratio label against the live web utility before final execution. Broker verification is the final step. Always confirm the current bid-ask spread on the specific SPY strike before order transmission. This data-centric approach to 0DTE risk management minimizes exposure to stale data. It ensures that every trade aligns with the intended technical level. Precision data is the primary defense against execution slippage in the 2026 market environment.
Standardizing High-Frequency Execution Protocols
Dynamic tracking replaces the static 10:1 multiplier. You’ve implemented custom ThinkScript labels and workspace configurations to reduce execution error. These technical layers ensure index technical levels map to the correct liquid ETF strikes. Maintaining this spx spy ratio thinkorswim logic requires constant verification against live market variables. Just as Computer Market Research automates complex data for global sales channels, traders must account for dividend drag and tracking error with four-decimal precision for 0DTE strike selection. Failure to account for cost-of-carry variables results in delta miscalculation and unnecessary slippage.
Manual maintenance of complex studies often leads to calculation latency. For maximum functional efficiency, access the real-time SPX to SPY Strike Price Converter at spxtospy.ai. This clinical, high-frequency data interface provides a 6-second ratio refresh frequency. It ensures precision strike mapping for 0DTE strategies without the overhead of manual script updates. Use this utility as a primary redundancy to secure your execution data. High-precision data allows you to focus exclusively on technical entry signals. Precise data entry is your most effective risk management tool.
Frequently Asked Questions
How do I see the SPX to SPY ratio in Thinkorswim?
Input the symbol syntax SPX/SPY directly into the symbol box within the Charts tab. You must configure the chart settings to Equities mode to prevent decimal truncation. This setting ensures the platform calculates the relationship between the index and the ETF with the four-decimal precision required for professional technical analysis. Use a Comparison study to visualize real-time price action correlation on a single pane.
What is the exact SPX SPY ratio formula for options?
The core mathematical relationship is Live SPX Price divided by Live SPY Price. For strike mapping, apply the formula: SPX Target Level / Current Ratio = SPY Equivalent Strike. This calculation accounts for the specific tracking error and cost-of-carry variables present in the market. Verified data from July 2026 indicates the ratio frequently fluctuates near the 10.05 level rather than the legacy 10.00 integer.
Why is the SPX to SPY ratio not exactly 10.00?
Structural divergence prevents a perfect 10:1 correlation. SPY incurs a 0.0945% annual expense ratio and experiences NAV drops during quarterly dividend distributions. These factors create a predictable ratio expansion that the SPX cash index does not reflect. Management fees and rebalancing drag within the SPY Trust contribute to a cumulative tracking error that shifts the ratio away from the static benchmark. Traders who understand the full spx spy ratio meaning, including the Unit Investment Trust cash drag and European-style settlement differences, are better equipped to account for these structural deviations in their strike mapping protocols.
Can I use a ThinkScript to automate SPX to SPY conversion?
Yes. Implement a custom spx spy ratio thinkorswim script using the AddLabel function. Define variables for the closing prices of SPX and SPY, then divide the two values to generate a real-time visual indicator. This automation eliminates the calculation latency associated with manual division. It provides a constant data point for 0DTE traders to monitor ratio drift during high-volatility market sessions.
How often does the SPX SPY ratio change during market hours?
The ratio changes with every tick of the underlying index and ETF. High-frequency data feeds typically utilize a 6-second refresh threshold to maintain decimal integrity without overwhelming system resources. Continuous fluctuations occur due to bid-ask spread movement and liquidity shifts in the SPY option chain. Professional traders require this frequency to ensure strike mapping remains accurate during rapid price discovery phases.
Does the SPX SPY ratio account for dividends in Thinkorswim?
The SPX/SPY chart syntax reflects live market pricing, which incorporates dividend-related NAV reductions. When SPY goes ex-dividend, its price drops relative to the SPX cash index. This event causes the ratio to expand. Thinkorswim charts this divergence automatically as it occurs in the live feed. Traders must recognize this expansion to avoid selecting strikes that no longer align with index-level technical support.
What is the best way to map SPX strikes to SPY for 0DTE?
Divide your target SPX technical level by the live four-decimal ratio. Round the resulting figure to the nearest liquid SPY strike based on your specific risk profile. Select the higher strike for resistance levels and the lower strike for support levels. This protocol preserves intended delta exposure. It prevents the execution errors commonly associated with using the inaccurate 10:1 static multiplier during high-stakes scalping.
Why do SPX and SPY prices diverge after market close?
Session mismatch causes significant after-hours divergence. The SPX cash index remains static after the 4:00 PM ET close. SPY continues to trade in the electronic session until 8:00 PM ET. This creates extreme ratio volatility as the ETF reacts to after-market news while the index benchmark is frozen. Traders must wait for the following market open for the ratio to normalize and provide accurate spx spy ratio calculation and strike mapping data.