A 0.01 deviation in the SPX:SPY ratio results in immediate strike misalignment and execution slippage. As of July 24, 2026, SPX trades at 7,411.98 while SPY sits at $738.93. The resulting 10.0306 ratio invalidates static 10:1 assumptions. Precise spx spy strike equivalence requires accounting for the current 1.02% dividend yield and the cost of carry. Mental math errors during 0DTE windows lead to sub-optimal fills and increased capital risk.
We agree that manual mapping is insufficient for professional execution. This technical mapping ensures you master the mathematical relationship between index and ETF instruments. You’ll gain the specific conversion formulas needed to eliminate slippage and ensure vertical spread parity. We’ll examine the technical drift caused by settlement differences and provide the mapping protocols required for precise trade execution. This guide delivers the data-centric framework for real-time ratio tracking and strike selection.
Key Takeaways
- Quantify the mathematical mapping between SPX index levels and SPY ETF prices to achieve precise contract alignment.
- Calculate spx spy strike equivalence using live ratios to mitigate the 0.01 deviation risks inherent in static 10:1 models.
- Identify how dividend ex-dates and management fees disrupt the 10:1 equilibrium, causing measurable ratio drift over time.
- Apply automated cost-of-carry adjustments to 0DTE strategies to ensure vertical spread parity and reduce capital risk.
- Utilize real-time tracking with 6-second refresh intervals to eliminate execution slippage during high-frequency trading windows.
Defining SPX SPY Strike Equivalence in Options Trading
SPX SPY strike equivalence is the mathematical mapping of index levels to ETF prices. It establishes the pricing relationship between the S&P 500 Index (SPX) and the SPDR S&P 500 ETF Trust (SPY). One SPX contract represents 100 units of the underlying index value. SPY represents approximately 1/10th of that index value. Equivalence allows traders to translate strategies between cash-settled and physically-settled markets. This mapping is essential for maintaining risk parity across different instrument types. Precise calculation prevents the selection of strikes with mismatched delta profiles.
Market participants use equivalence to bridge regulatory and settlement gaps. SPX options are European-style, cash-settled, and offer Section 1256 tax treatment. SPY options are American-style, physically-settled, and track the ETF shares directly. Mapping ensures a 7410 SPX call aligns with the equivalent SPY strike. Current market data from July 24, 2026, shows SPX at 7,411.98 and SPY at $738.93. The resulting 10.0306 ratio confirms that static 10:1 assumptions are inaccurate. Precise conversion is mandatory to avoid execution gaps and capital misallocation.
The 10:1 Proportionality Rule
The 10x multiplier originated in early S&P 500 derivative specifications. It provides a theoretical framework for comparing index levels to ETF prices. Many traders assume a simple decimal shift is sufficient for strike selection. An SPX strike of 7400 is frequently equated to a SPY strike of 740. This baseline ignores tracking error, dividend yields, and management fees. The 10:1 rule is a baseline for strike mapping. Real-time data shows frequent deviations from this round number. Relying on the 10:1 rule during high-volatility periods leads to strike selection errors. Technical mapping requires moving beyond this decimal simplification to achieve execution precision.
Why Precise Mapping Matters for Day Traders
Strike misalignment directly impacts delta and gamma exposure. Selecting a strike that’s 1.00 off in SPX terms alters the Greeks of a vertical spread. This change affects the probability of profit and the rate of theta decay. Execution risks increase when using ETF-only brokers for index-based signals. Traders observing SPX price action must execute on SPY without latency. Inaccurate mapping causes slippage and sub-optimal fills. Equivalence is also required for hedging SPX positions with SPY options. Effective delta hedging depends on the exact ratio between the index and the ETF. A 0.01 ratio error creates unhedged exposure in large positions. Precision is required to maintain strategy integrity. Professional 0DTE traders prioritize this data to avoid the risks of mental math estimation.
The Mathematical Framework of Strike Mapping
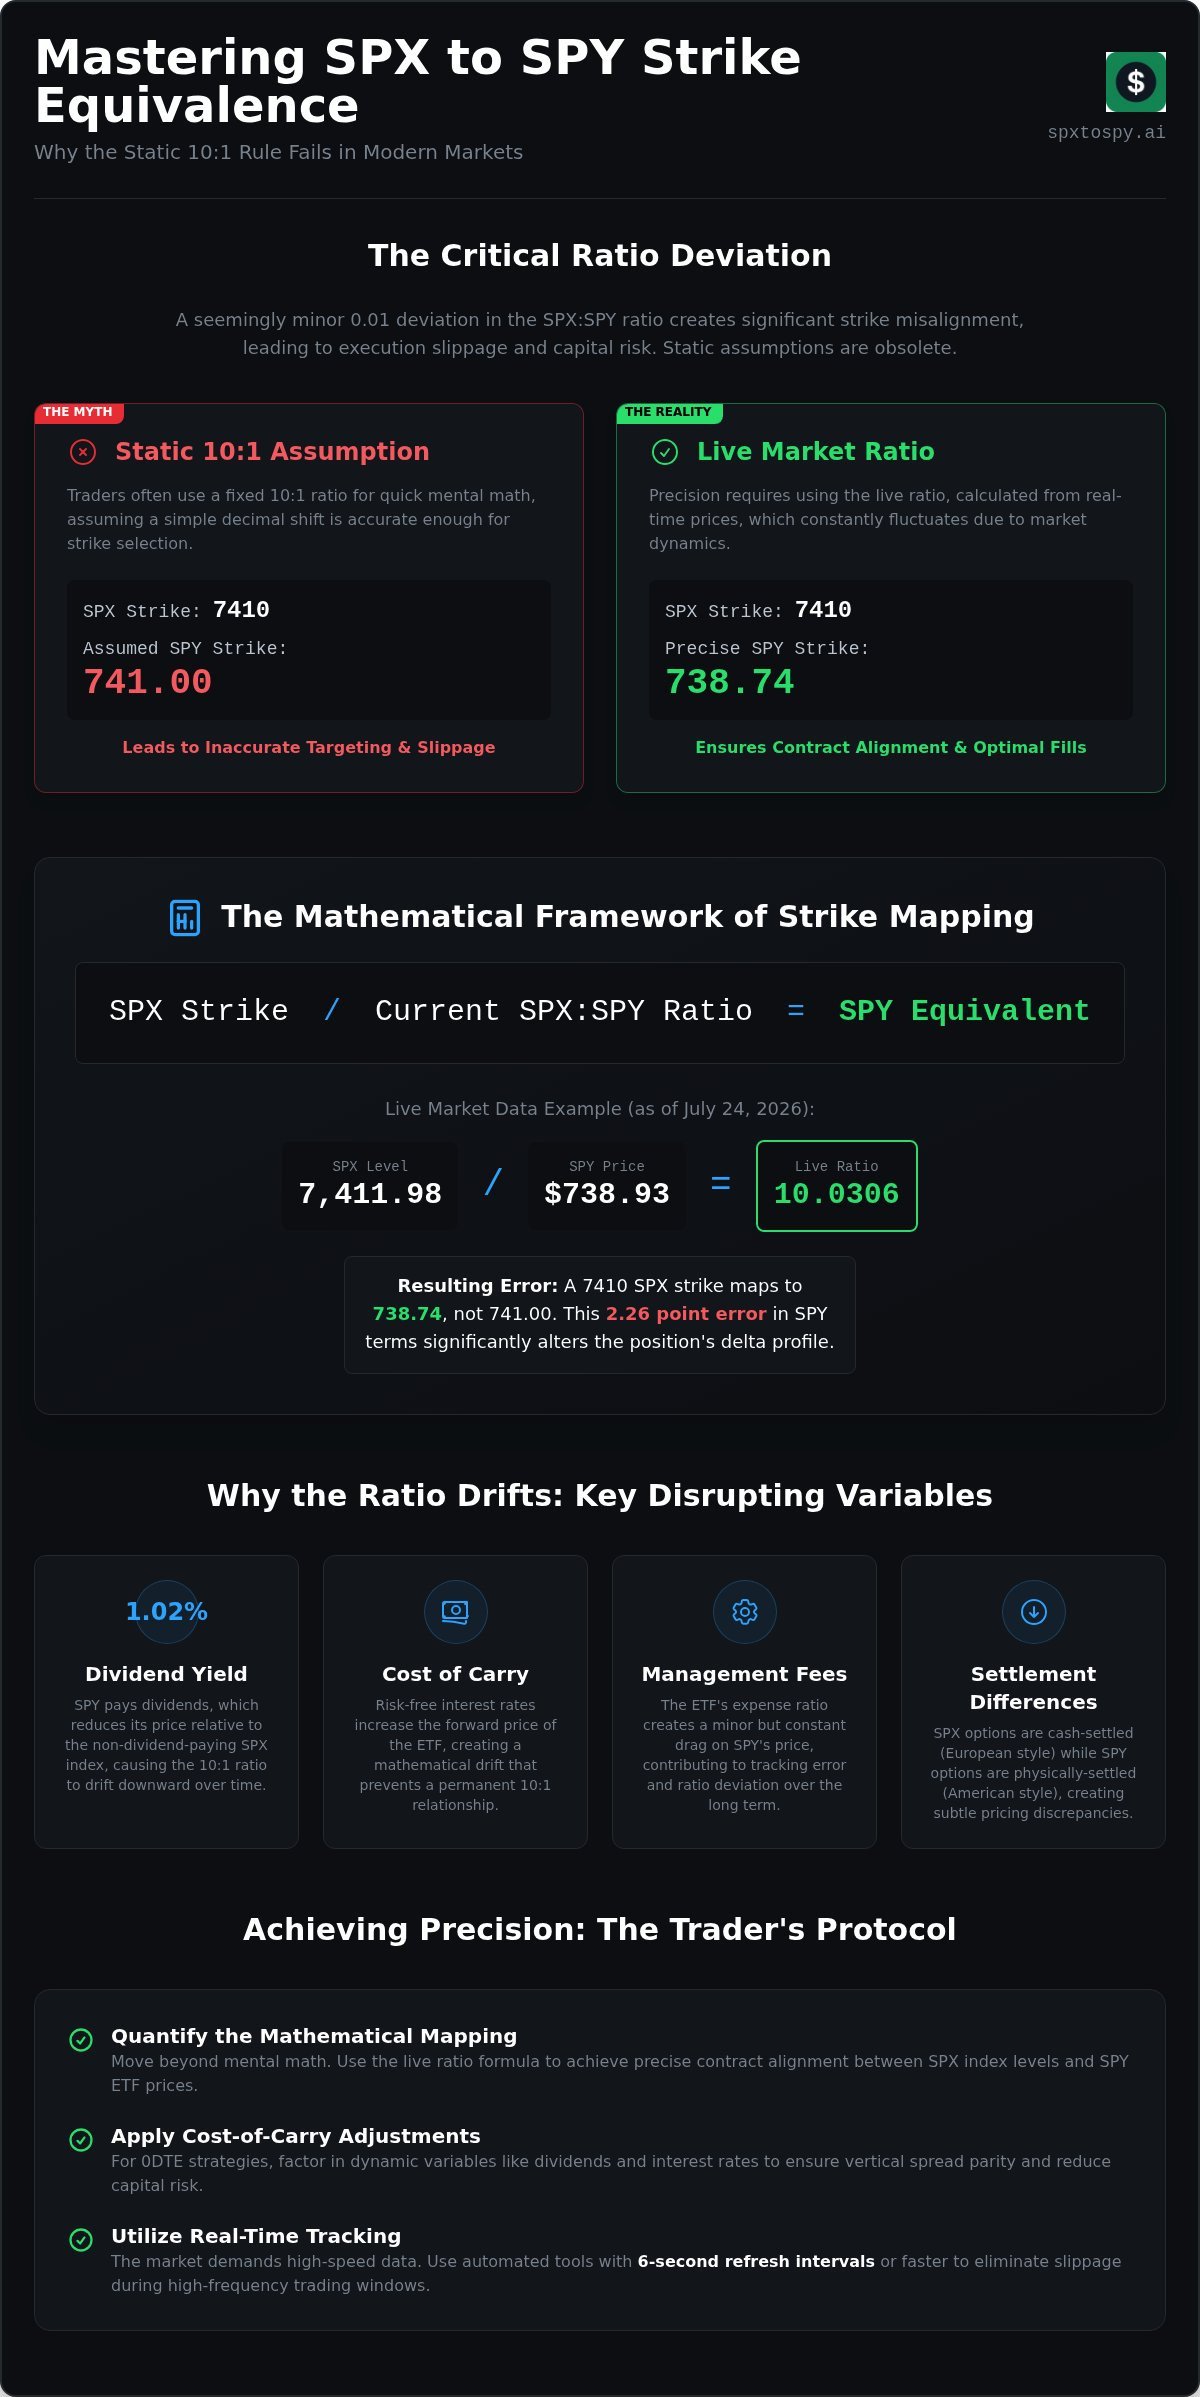
The core formula for spx spy strike equivalence is: SPX Strike / Current SPX:SPY Ratio = SPY Equivalent. This calculation replaces the obsolete 10:1 mental model. As of July 24, 2026, the SPX:SPY ratio is 10.0306 based on an SPX level of 7,411.98 and a SPY price of $738.93. A target SPX strike of 7410 divides by 10.0306 to yield a SPY equivalent of 738.74. Using a static 10.0 divisor would result in a 741.00 strike, creating a 2.26 point error in SPY terms. This misalignment significantly alters the delta profile of the intended position.
Precision requires four decimal points for professional ratio tracking. This level of detail captures micro-movements in the underlying spread that 2-digit rounding ignores. Bid-ask spreads on SPY also influence the effective conversion ratio. Traders must use the relevant side of the spread depending on the trade direction. Buy-side conversions require the ask-based ratio for accurate cost estimation. Sell-side conversions utilize the bid-based ratio to calculate realistic credit receipts. The inverse relationship applies for translating SPY-based technical levels back to index values: SPY Strike * Live Ratio = SPX Equivalent. This inverse mapping is critical when managing multi-leg spreads across both instruments.
Calculating the Live Market Ratio
Real-time data sourcing is the only method to maintain mapping accuracy. Index feeds from the S&P 500 must be synchronized with consolidated ETF tapes to prevent latency-induced errors. 2026 market environments demand 6-second refresh cycles to account for rapid price fluctuations during 0DTE windows. Manual calculations cannot match this speed. Utilizing an SPX to SPY Converter provides the necessary automation for high-frequency environments. This tool maintains the 10.0306 ratio accuracy during peak volume periods when spreads widen.
Cost of Carry and Mathematical Drift
Forward pricing dynamics prevent a permanent 10:1 relationship between these instruments. Risk-free interest rates increase the forward price of the ETF through the cost of carry. Conversely, the 1.02% dividend yield on SPY reduces the ETF price relative to the cash index. These variables create continuous mathematical drift. Consult the SPX Options Specifications for detailed contract settlement parameters. Cost of carry is the primary driver of ratio non-linearity. This drift isn’t constant and fluctuates based on the 2026 interest rate environment and dividend schedules. Precise mapping requires continuous adjustment for these carry costs to maintain strike parity. Monitoring the live market ratio ensures your strikes remain aligned with current price action.
Variables Disrupting the 10:1 Equilibrium
The 10:1 proportionality is a theoretical construct that fails under live market conditions. Institutional arbitrage and structural variables create constant fluctuations in the SPX:SPY ratio. As of July 24, 2026, the realized ratio of 10.0306 deviates significantly from the 10.00 decimal baseline. This divergence is driven by dividend distributions, cost of carry, and management fees. Precise spx spy strike equivalence requires monitoring these variables in real-time to prevent execution errors and strike selection gaps.
Dividend ex-dates represent the most significant discrete disruptor to this equilibrium. SPY distributes quarterly dividends while SPX is a price-return index that doesn’t account for cash payouts. On the June 18, 2026 ex-dividend date, the SPY price adjusted downward by the payout amount. This event caused an immediate expansion in the conversion ratio. Traders who don’t adjust their strike mapping during these windows experience immediate delta misalignment. The 1.02% trailing dividend yield on SPY ensures this drift remains a permanent feature of the mathematical landscape.
Institutional arbitrageurs maintain the ratio within a tight band through high-frequency execution. Market makers exploit micro-discrepancies between S&P 500 futures, the cash index, and the ETF. This activity ensures that spx spy strike equivalence remains mathematically consistent despite individual instrument volatility. Without this constant arbitrage pressure, tracking error would expand beyond manageable levels. These mechanics ensure that deviations are usually mean-reverting over short timeframes, though they remain critical for intraday precision.
Intraday Volatility and the SPX:SPY Ratio
Ratio expansion occurs during periods of high-velocity price action. The New York open and close often exhibit increased volatility as liquidity providers rebalance positions. Liquidity gaps or ‘fat finger’ trades in the ETF tape cause temporary spikes in the ratio. Monitoring the live ratio today is critical for 0DTE traders who require sub-second precision. Even a 0.005 shift in the ratio moves a SPY equivalent strike by several cents, directly impacting fill quality and spread parity.
ETF Management and Structural Decay
Structural decay is a long-term factor in strike mapping. SPY carries a 0.0945% gross expense ratio that’s priced into the Net Asset Value (NAV) over time. This creates a slow, permanent drift in the relationship between the index and the fund. Comparisons with lower-fee instruments reveal different equivalence profiles. Refer to SPX Strike Price in SPY for historical drift data and decay analysis. Understanding these structural nuances prevents long-term erosion in cross-instrument hedging strategies.
Tactical Execution: Mapping Strikes for 0DTE Strategies
Precision in 0DTE trading depends on the immediate translation of index-level signals into ETF-based execution. Identify the target SPX strike based on current technical resistance or support levels. For instance, if SPX technicals indicate a reversal at 7415, this becomes your primary input. Mapping spx spy strike equivalence requires converting this index level into a tradable ETF strike. Input the 7415 SPX strike into the SPX to SPY Converter to determine the exact mathematical equivalent. Current 2026 data shows that a 7415 SPX strike translates to approximately 739.24 in SPY terms. Verify this equivalent against the live SPY option chain liquidity. SPY strikes offer high granularity, but liquidity varies across the chain. Select the nearest liquid SPY strike, such as 739, to minimize bid-ask slippage. Execute the trade while monitoring for ratio refreshes every 6 seconds. This frequency ensures your execution remains aligned with the live market ratio during rapid price swings.
Gamma Risk and Strike Precision
Gamma risk is highly compressed in 0DTE instruments, making strike precision a requirement for survival. A 0.50 point error in SPY mapping equals a 5.00 point error in SPX. This discrepancy drastically alters the probability of profit and the speed of capital erosion. Professional traders avoid the danger of ’rounding to the nearest 5′ in 0DTE strike selection. Such rounding errors lead to mismatched delta profiles that don’t reflect the original trade thesis. Use the converter to identify the ‘true’ ATM strike across both instruments simultaneously. This level of precision ensures your delta exposure matches your index-level analysis. Failure to map accurately creates unintended directional bias and exposure to accelerated gamma decay near expiration.
Executing SPX Analysis on ETF Platforms
Many retail traders utilize TradingView for SPX technical analysis while executing orders on ETF-only platforms like Robinhood. This split-workflow requires a constant bridge between index-based signals and SPY-based execution. Consult the SPY Equivalent of SPX Strike guide for intraday mapping protocols. Maintaining this bridge is critical for managing complex multi-leg structures like iron condors or broken wing butterflies. For a broken wing butterfly, precise strike intervals are mandatory to preserve the desired risk-reward ratio. Inaccurate mapping breaks the symmetry of the wings, creating lopsided risk that can lead to unexpected losses. Use real-time market ratio tracking to synchronize your index analysis with your broker’s execution environment.
Real-Time Precision with the SPX to SPY Converter
Manual mental math is insufficient for professional trading environments. High-frequency market conditions invalidate static estimations and decimal-shift approximations. Latency in strike selection leads to sub-optimal fills and immediate capital erosion. Calculating spx spy strike equivalence manually requires simultaneous tracking of index levels, ETF prices, and carry costs. This multi-variable process is prone to error during peak volatility windows. Automated utilities remove this cognitive burden by processing live data feeds. spxtospy.ai automates cost-of-carry and ratio calculations instantly. This ensures mapping accuracy remains within the required four decimal points. Precision is mandatory for 0DTE execution where gamma risk is highest. Operational efficiency dictates the use of dedicated conversion instruments over manual spreadsheets or mental approximations.
The 2026 interest rate environment directly affects the cost of carry for ETF providers. These fluctuations alter the SPX:SPY ratio throughout the trading session. Real-time tracking accounts for these variables without requiring manual user input. A 6-second refresh cycle provides maximum intraday reliability for active day traders. This frequency captures micro-trends in tracking error and dividend pricing adjustments. Traders must maintain a responsible stance despite high data speeds. Always perform broker verification before final execution to ensure strike availability. The converter acts as a data-centric assistant rather than a direct execution engine. Use the tool to validate target strikes, then confirm liquidity on the broker tape. This two-step verification process minimizes execution risk in fast-moving markets.
Tool Specifications and Data Integrity
The technical architecture utilizes direct feeds from S&P 500 index providers and consolidated ETF tapes. This synchronization eliminates the time-gap between index movement and ETF reaction. 2026 traders require sub-10-second data refreshes for effective strike mapping during high-velocity price action. Slower refresh rates result in stale ratios during trend-day expansions or volatility spikes. Stale data causes strike misalignment and increased slippage on entry. Review the SPX SPY Strike Price Tool for operational details and data sourcing protocols. Reliability is established through high-frequency polling and algorithmic verification of the live market ratio. This ensures the spx spy strike equivalence remains accurate regardless of market regime.
Integrating the Converter into Your Trading Desk
Optimal workflow involves side-by-side monitor placement of the conversion utility. Position the converter adjacent to the SPY option chain for rapid scanning and order entry. This arrangement reduces cognitive load during high-volatility market events such as FOMC releases or economic data prints. Traders can focus on technical index analysis while the tool handles the mathematical mapping requirements. Immediate access to converted strikes prevents hesitation during critical entry windows. The converter serves as a transparent layer between index analysis and ETF execution. Efficiency is maximized when data flows directly from the tool to the order entry ticket. This methodical approach ensures strategy integrity and maintains risk parity across all instrument types.
Optimizing Execution Precision for Cross-Instrument Strategies
Accurate strike mapping is the technical requirement for maintaining risk parity between SPX and SPY positions. Static 10:1 ratios fail to account for the 1.02% dividend yield and cost-of-carry variables present in the 2026 market environment. Mastering spx spy strike equivalence eliminates the 0.50 point errors that result in mismatched delta profiles and unintended directional bias. Professional 0DTE execution requires sub-10-second data updates to capture intraday ratio drift caused by institutional arbitrage and structural decay. Manual mental math increases cognitive load and leads to execution slippage during high-volatility windows.
Automating this conversion process ensures your ETF strikes align exactly with your index-level analysis. Access the Real-Time SPX to SPY Strike Converter to utilize live market data tracking with 6-second refresh intervals. This zero-cost professional utility provides the precision required for complex multi-leg spreads and immediate hedge adjustments. Prioritize mathematical accuracy over estimation to maintain execution parity across all market regimes. Consistent strategy performance depends on the synchronization of your data and your execution platform.
Frequently Asked Questions
What is the standard ratio for SPX to SPY strike equivalence?
The standard ratio is approximately 10:1, but realized parity currently sits at 10.0306. This deviation stems from the divergence between the cash index and the fund’s net asset value. Professional spx spy strike equivalence requires using the live market ratio rather than a static integer. Relying on the 10x baseline during high-volatility sessions causes significant strike selection errors and misaligned delta profiles.
Why does the SPX:SPY ratio change throughout the trading day?
Intraday fluctuations result from tracking error and liquidity gaps between the underlying index and the ETF tape. Market makers and arbitrageurs continuously adjust positions to maintain price alignment. These micro-movements cause the ratio to expand or contract by several basis points throughout the session. Precise mapping depends on capturing these shifts via high-frequency data refreshes to ensure execution parity remains intact.
How do dividends affect the SPY equivalent of an SPX strike price?
Dividends create a structural downward drift in the SPY price relative to the SPX index. SPY is a dividend-paying trust with a 1.02% trailing yield; however, SPX is a price-return index. On ex-dividend dates, the ETF price drops by the distribution amount, instantly altering the conversion ratio. Mapping protocols must account for these scheduled payouts to preserve strike parity across both instruments.
Can I use a simple 10x multiplier for 0DTE options mapping?
No. A simple 10x multiplier is insufficient for 0DTE environments due to high gamma sensitivity. Small mapping errors result in mismatched delta profiles and unintended directional exposure. Professional spx spy strike equivalence demands 4-point decimal precision to ensure vertical spread parity. Rounding to the nearest 10x baseline increases execution risk and capital erosion during rapid price reversals and high-velocity moves.
Is SPX strike equivalence the same for calls and puts?
The mathematical mapping remains identical for calls and puts. Both contract types track the same underlying price relationship between the index and the ETF. However, traders should utilize the relevant side of the bid-ask spread when calculating the ratio for execution. Buy-side orders require the ask-based ratio to determine realistic entry costs, while sell-side orders utilize the bid-based ratio for credit calculations.
What happens to strike equivalence during a stock split or index rebalancing?
Stock splits in the ETF require a proportional adjustment to the conversion denominator. Rebalancing events affect the index composition and the fund’s tracking efficiency. These structural changes necessitate an immediate recalibration of the mapping formula. Traders must verify updated contract specifications from the exchange to ensure their conversion tools reflect the new instrument parameters and maintain mathematical integrity.
How often should I refresh the SPX to SPY conversion ratio?
Active day traders should refresh the conversion ratio every 6 seconds. High-frequency updates are mandatory during 0DTE windows to account for rapid price action and liquidity shifts. Refreshing at this interval ensures that execution remains synchronized with the live market tape. Stale data leads to slippage and sub-optimal fills during peak volume periods when spreads often expand rapidly.
Does the cost of carry significantly impact strike mapping for LEAPS?
Cost of carry is a critical variable for long-duration instruments like LEAPS. Interest rates and dividend yields compound over time, creating a non-linear relationship between the index and the ETF. This drift is more pronounced in LEAPS than in short-term options. Mapping these strikes requires accounting for the forward price of the underlying fund rather than current spot levels to ensure long-term strategy parity.