The 10x multiplier is a mathematical approximation. Reliance on fixed ratios during high volatility causes execution drift and capital inefficiency. Tracking error is a persistent risk when converting SPX levels to SPY strikes. You recognize that inaccurate mapping leads to execution errors and PnL slippage. This technical analysis defines the mechanics of the spx spy price relationship to ensure precise strike price conversion. We analyze the 0.0945% SPY expense ratio and the July 2026 dividend distribution impact on price divergence.
Operational efficiency necessitates understanding why the ratio fluctuates. This framework minimizes mapping errors and execution risk. Data points include settlement variances, Section 1256 tax implications, and real-time ratio adjustments. Current volatility requires specific attention to the July 31, 2026, dividend payment of $1.90 per share. This review covers contract specifications, the June 4, 2026, PDT rule elimination, and tracking error mitigation. Precision is the priority for high-frequency reference data. Use these metrics to stabilize strike selection and mitigate risk during rapid market shifts.
Key Takeaways
- Define the spx spy price relationship by identifying why the theoretical 10x multiplier deviates between 9.95 and 10.05 in live market conditions.
- Execute precise strike price mapping by applying dynamic mathematical ratios to eliminate execution drift and PnL slippage.
- Factor in dividend distributions and interest rates to account for the structural price divergence between the cash index and the tradable ETF.
- Leverage real-time ratio tracking with a 6-second refresh rate to maintain data integrity during high-volatility trading sessions.
- Minimize tracking error risk through technical synchronization of SPX levels and corresponding SPY equivalents for accurate execution.
Structural Definition of the SPX and SPY Relationship
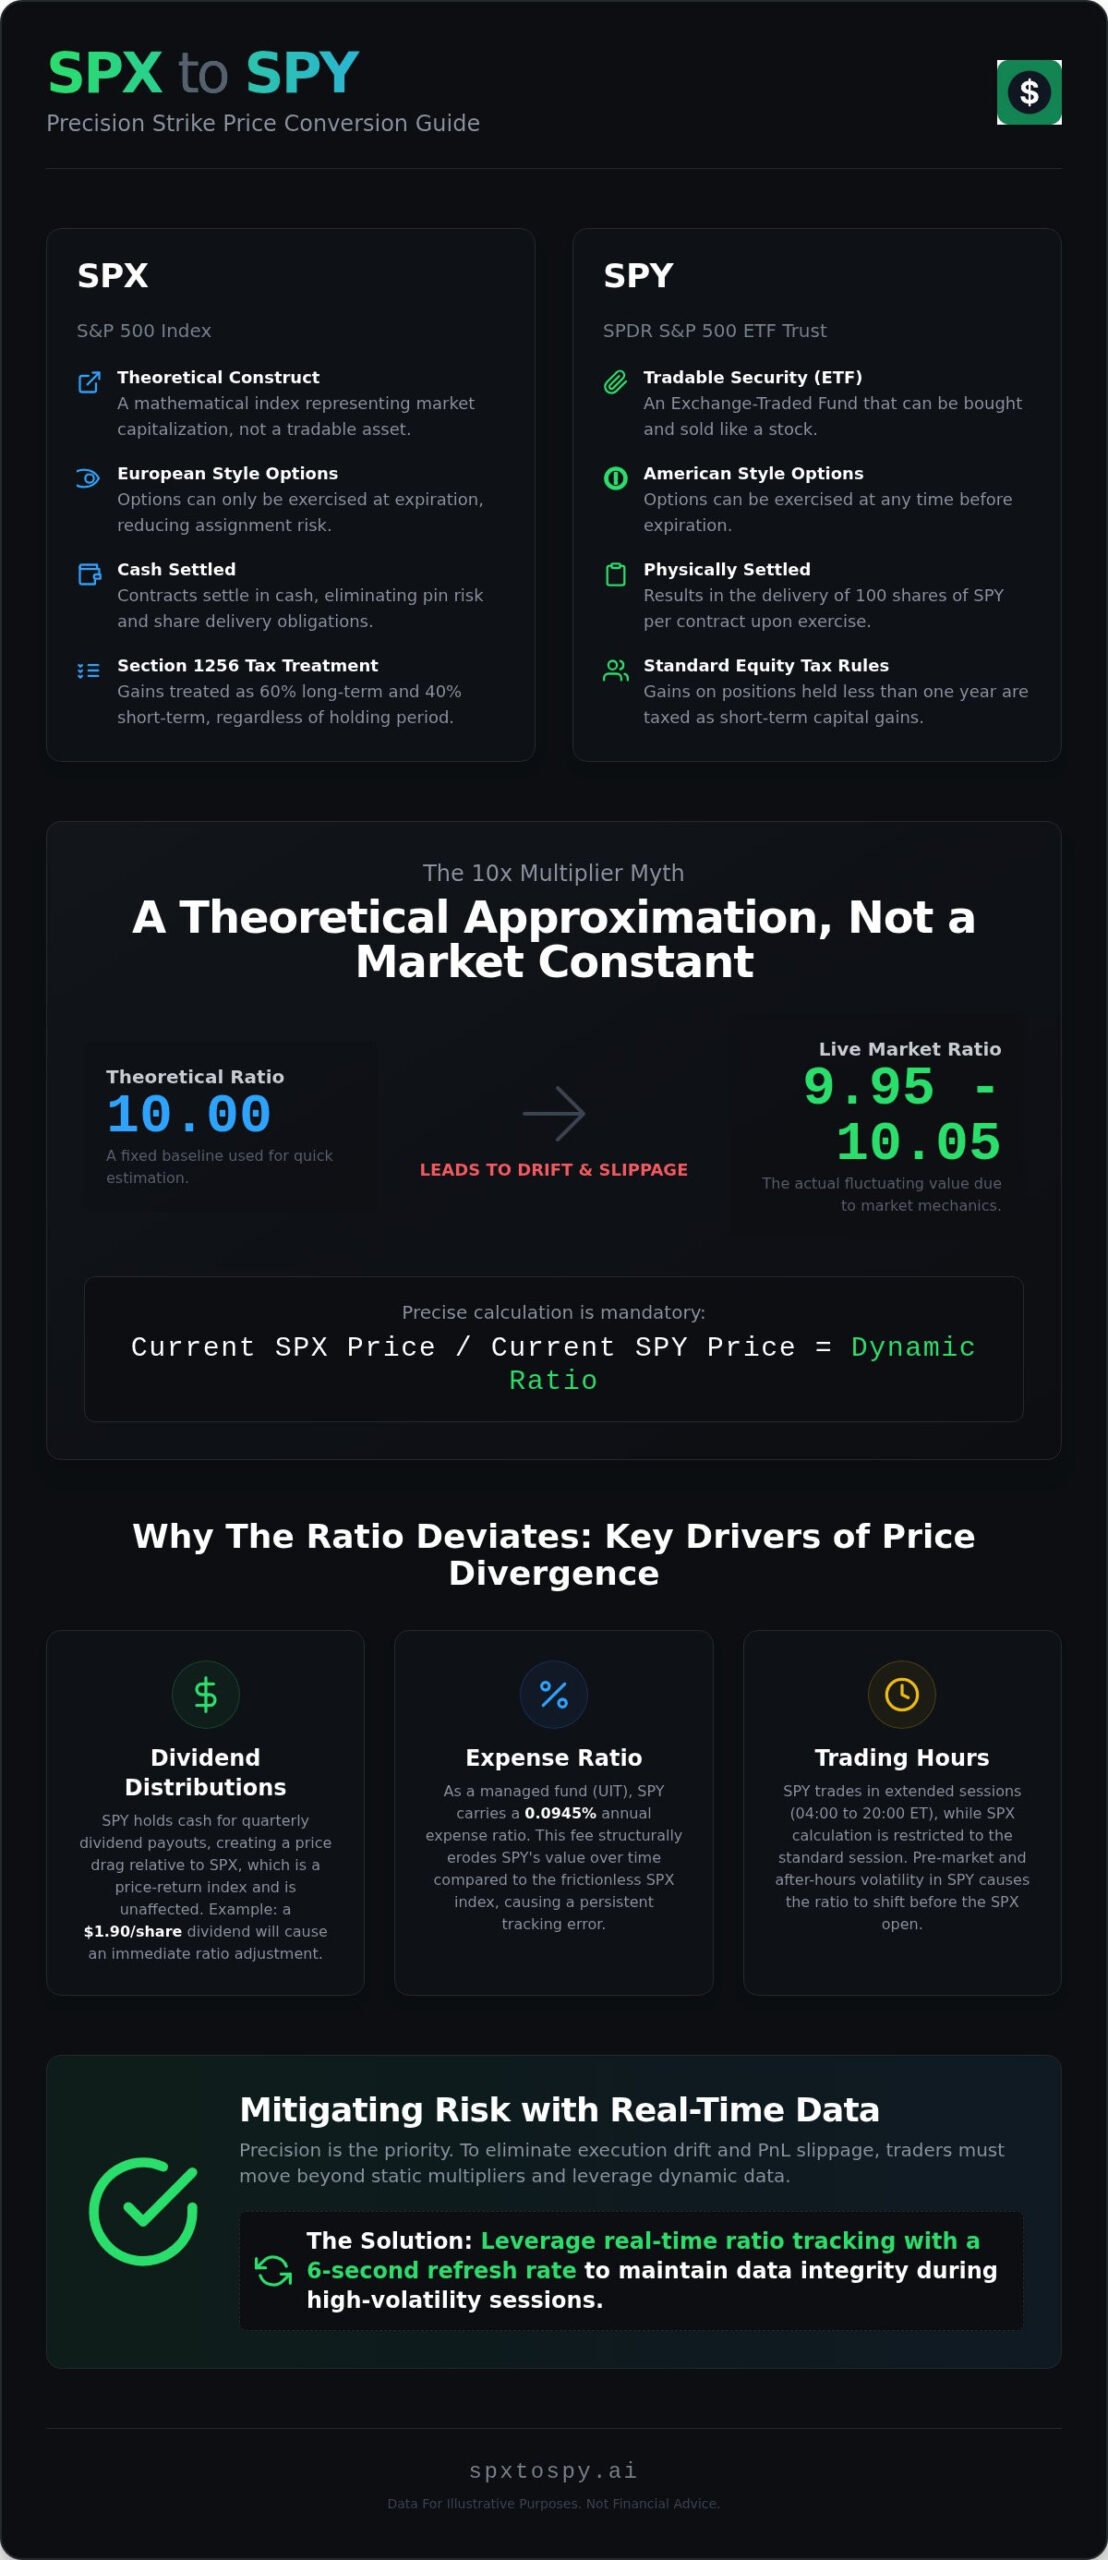
SPX is the S&P 500 Index. It is a theoretical mathematical construct. It represents the market capitalization of 500 large-cap US equities. SPY is the SPDR S&P 500 ETF Trust. It is a tradable security. It tracks the index performance. The spx spy price relationship is based on a structural 10x multiplier. One SPX point equals approximately ten SPY points. This ratio is the baseline for strike mapping. SPX options are cash-settled. They use European style exercise. No assignment risk exists. SPY options are physically settled. They use American style exercise. Share delivery occurs upon exercise. These structural differences dictate execution strategy. They cause price divergence during expiration cycles.
Index vs. ETF Operational Mechanics
SPX represents pure market capitalization weighting. No direct ownership friction occurs. It lacks an expense ratio. SPY is a Unit Investment Trust (UIT). It carries a 0.0945% expense ratio. This fee creates a constant price drag. SPY holds 500 underlying stocks. It requires custodial management and dividend processing. Institutional hedging centers on SPX. Daily volume reached 4,877,972 contracts on July 27, 2026. Open interest is 21,868,024. Retail and high-frequency trading focus on SPY. SPY assets under management exceed $777 billion. Liquidity depth varies by instrument. SPX notional value is 10x higher. One SPX contract represents roughly $750,000 in notional value when the index is at 7,500. One SPY contract represents $75,000.
Technical Implications for Options Traders
Strike equivalence requires precise calculation. The spx spy ratio meaning refers to the specific mathematical value used to align index levels with ETF price points for accurate execution. Settlement styles dictate capital risk. Cash settlement eliminates pin risk. Physical settlement introduces share delivery obligations. This affects margin requirements. Tax treatment differs significantly. SPX options are Section 1256 contracts. They receive 60/40 tax treatment. 60% is long-term capital gains. 40% is short-term. This applies regardless of the holding period. SPY options follow standard equity tax rules. Gains on positions held under one year are short-term capital gains. Professional traders prioritize SPX for tax efficiency. High-frequency traders use SPY for granular strike access and smaller capital requirements. The spx spy price relationship remains the primary metric for cross-instrument arbitrage and hedging.
The 10x Multiplier and Real-Time Ratio Deviation
The 10x multiplier is the standard theoretical baseline for the spx spy price relationship. One SPX point represents ten SPY points in a static environment. Observed market reality contradicts this constant. The live ratio typically fluctuates between 9.95 and 10.05. Traders must utilize the specific computational logic: Current SPX Price / Current SPY Price = Dynamic Ratio. This calculation identifies the tracking error. Tracking error is the measurable delta between the ETF performance and the underlying index benchmark. Precision in this calculation is mandatory for strike mapping and delta-neutral positioning. Small deviations result in significant execution drift when trading large contract sizes.
Execution errors often stem from assuming a fixed 10.00 ratio. Volatility and liquidity shifts cause the ratio to expand or contract intraday. Basis risk increases during high-velocity price action. A real-time ratio tracker provides the necessary data to compensate for these fluctuations. Precise mapping requires a 6-second refresh rate to capture micro-movements in the basis. Failure to account for the dynamic ratio leads to inaccurate strike selection and sub-optimal entry prices.
Why the 10x Ratio is Not Constant
Dividend accrual is a primary driver of ratio deviation. SPY is a Unit Investment Trust (UIT) that holds cash for quarterly distributions. This creates a price drag relative to the SPX index, which is a price-return construct. For example, the scheduled $1.90 per share dividend on July 31, 2026, will cause an immediate adjustment in the ratio. SPX remains unaffected by these cash flows. Expense ratios also contribute to the erosion of SPY value. The 0.0945% annual fee is structurally integrated into the ETF price. Market hours create further divergence. SPY trades in extended sessions from 04:00 to 20:00 ET. SPX calculation is restricted to the standard session. Pre-market and after-hours movements in SPY cause the ratio to shift before the SPX open.
Mathematical Deviation Analysis
High-frequency execution depends on understanding the spx spy 10x ratio explained in the context of basis risk. Basis risk is the uncertainty regarding the spread between the index and the tracking vehicle at expiration. Arbitrageurs perform a critical role in maintaining the 10x proximity. These institutional players buy or sell the delta between the two instruments when the ratio exceeds historical norms. Their activity compresses the deviation but does not eliminate it. Traders must quantify the cost of carry and dividend impact to predict ratio movement. Use live data feeds to synchronize SPX levels with SPY equivalents. This technical synchronization is the only method to ensure execution accuracy in 0DTE and short-term options strategies.
Strike Price Mapping: Converting SPX to SPY Equivalents
Strike price mapping requires the identification of a target SPX level. Example: 5800. Traders must apply the current live ratio. Don’t use the 10x constant. Observed market ratios often sit at 10.012 or similar decimals. Divide the SPX strike by the live ratio. 5800 / 10.012 = 579.30. Select the nearest liquid SPY strike. Choice: 579 or 580. Selection depends on delta requirements and capital constraints. The spx spy price relationship dictates this conversion accuracy. Static mapping causes PnL slippage. Accurate conversion is critical for 0DTE strategies where every cent of strike deviation impacts the Greek profile. Execution drift occurs when using estimated ratios. Intraday volatility expands the basis. This creates a gap between the index level and the ETF price. Traders must synchronize these variables to maintain hedge integrity.
Liquid SPY strikes offer 1-point increments. SPX offers 5-point and 25-point increments. Mapping requires aligning these disparate scales. If the SPY equivalent is 579.30, a trader seeking higher delta selects 579. A trader seeking lower premium cost selects 580. This choice depends on the specific Greeks of the position. Delta, gamma, and theta vary between the two strikes. Mapping must account for these Greek profiles to ensure the intended risk-reward ratio remains intact. High-frequency environments demand instant recalculation as the ratio shifts.
Precision in Strike Mapping
Decimal precision defines execution quality. Use the spx spy ratio calculation to determine exact strike alignment. OTM strikes require tighter tolerances. ITM strikes are sensitive to delta shifts. Rounding protocols must be consistent. 0DTE scalping mandates zero-latency mapping. Intraday ratio drift occurs during rapid price discovery. Adjust calculations every six seconds. This refresh frequency maintains mapping integrity. Failure to adjust for drift results in selecting strikes that don’t represent the intended index level. This risk is elevated during the July 2026 expiration cycles due to dividend-driven basis shifts.
Operational Workflow for Day Traders
Manual calculation is inefficient. Order entry speed dictates profitability. Use the SPX to SPY Converter for rapid strike translation. Verify strike availability within the broker interface. Not all brokers support full SPY option chains or granular strikes. Map SPX puts to SPY equivalents for portfolio hedging. Synchronize strikes before volatility spikes. This workflow mitigates tracking error. It ensures the spx spy price relationship remains a functional trading variable. Maintain a secondary reference for ratio validation. Cross-check converted strikes against live option chains to confirm liquidity and bid-ask spreads before execution.
Market Variables Impacting Price Correlation
Interest rates dictate the cost of carry for the SPY ETF. Higher rates increase the forward price of the ETF relative to the SPX cash index. This creates a widening in the spx spy price relationship. Cost of carry represents the net difference between interest paid to hold the position and dividends received. Liquidity imbalances also trigger temporary ratio spikes. Extreme buy or sell pressure on SPY, particularly during institutional rebalancing, forces the ETF to trade at a premium or discount to its Net Asset Value (NAV). High-beta environments and VIX spikes increase the frequency of these deviations. During periods of extreme volatility, the correlation between the index and the tracking vehicle can decouple. This forces the ratio outside the standard 9.95 to 10.05 range. Professional traders must quantify these variables to maintain delta neutrality across complex positions.
Maintain strike accuracy by utilizing live market ratio tracking to offset intraday liquidity imbalances and cost of carry shifts.
The Role of Dividend Drag
Dividend distributions are a primary driver of structural ratio expansion. SPY forward dividend yield is approximately 1.01% to 1.03% as of late July 2026. When SPY components go ex-dividend, the ETF price drops by the dividend amount. SPX is a price index. It does not adjust for these cash distributions. This creates a persistent price drag on the ETF. For example, the $1.90 per share dividend scheduled for July 31, 2026, will cause a measurable shift in the 10x multiplier. Mapping models must account for these quarterly cycles. Long-term conversion models require adjustments to prevent strike mapping errors during heavy dividend months. Failure to synchronize the ratio with the dividend schedule leads to significant tracking error in LEAPS and long-dated option strategies.
Structural Differences in Settlement
The spx vs spy settlement difference impacts price parity by introducing divergent exercise risks and timing variables into the correlation model. SPX options are European style. They lack early assignment risk. Settlement for standard monthly SPX contracts occurs at the Friday open (AM settlement) based on the opening price of all 500 components. This introduces significant overnight risk between Thursday’s close and Friday’s SET calculation. SPY options are American style. They are subject to early exercise. Settlement occurs at the Friday close (PM settlement). These timing differences cause the spx spy price relationship to fluctuate as expiration approaches. SPY strikes frequently experience “pinning.” Market makers drive the price toward strikes with high open interest. This pinning effect is absent in SPX due to its cash-settled nature. Traders must monitor these mechanics to avoid execution drift during the final hours of a trading session.
Technical Execution: Utilizing Live Conversion Data
Technical execution requires high-fidelity data feeds. The spx spy price relationship is dynamic. Static ratios fail during rapid price discovery. Operational efficiency depends on live ratio tracking. A 6-second refresh rate ensures intraday precision. This frequency captures micro-movements in the basis. It minimizes the gap between index movement and ETF reaction. Data latency remains a primary risk factor in high-frequency environments. Automated strike mapping eliminates manual calculation errors. Fast markets leave no room for arithmetic drift. Verifying all conversions with broker data is a mandatory risk management protocol. Traders must cross-reference converted strikes against live bid-ask spreads. Don’t execute without secondary validation of the mapping output.
Precision mapping requires constant synchronization. The spx spy price relationship shifts based on order flow and arbitrage activity. Static models are obsolete within minutes of the opening bell. Use automated tools to maintain strike alignment. This protocol reduces PnL slippage. It ensures that the selected SPY strike accurately reflects the intended SPX level. High-volatility events expand the ratio deviation. Real-time tracking is the only method to maintain execution integrity under these conditions. Reliable data is the difference between a precise hedge and an execution error.
High-Frequency Ratio Monitoring
A 6-second refresh is superior to static or daily updated ratios. Static models ignore intraday basis shifts driven by liquidity. Monitoring ratio standard deviation identifies mean reversion opportunities. When the ratio moves two standard deviations from the mean, arbitrageurs typically intervene. Technical specifications of the real-time conversion tool prioritize low-latency throughput. The utility synchronizes the cash index with the tradable ETF by processing live price ticks. This precision is essential for 0DTE scalping and delta-neutral hedging. High-frequency monitoring captures micro-deviations that occur during institutional rebalancing or news-driven volatility. It provides a clinical view of the basis risk.
Final Execution Protocols
Follow a step-by-step verification process for every trade. Identify the target SPX strike. Recalculate the equivalent using the live ratio. Confirm the SPY strike availability. Check the broker’s option chain for volume and open interest. Integrating live ratio data into trading dashboards streamlines the operational workflow. This reduces cognitive load during high-volatility sessions. It allows for rapid decision-making without sacrificing accuracy. Access the Real-Time SPX to SPY Converter to automate this technical mapping. Maintain a clinical focus on data integrity. Precision in the conversion process is the baseline for professional risk management and capital preservation.
Precision Execution and Ratio Synchronization
The spx spy price relationship is a dynamic variable influenced by the 0.0945% SPY expense ratio and structural dividend distributions. Fixed 10x multipliers are insufficient for high-frequency execution. They introduce tracking error and PnL slippage. Professional traders must synchronize their mapping models with live market ratios to maintain data integrity. This framework ensures that SPY strike selection accurately reflects the underlying SPX index level. Use no-cost technical utilities to automate these calculations and eliminate manual arithmetic drift.
Convert SPX Strikes to SPY in Real-Time
This utility provides a 6-second ratio refresh frequency and dedicated 0DTE strike mapping precision. It acts as a transparent layer between the index and the ETF for immediate decision-making. It’s essential to maintain strike parity to stabilize your execution workflow. Reliable data is the primary requirement for successful cross-instrument strategies. Optimize your technical execution with verified mapping output today.
Frequently Asked Questions
How do you calculate the SPX to SPY ratio?
Calculate the ratio by dividing the current SPX index level by the current SPY share price. This formula provides the specific multiplier required for technical strike mapping. Use live price ticks to ensure calculation accuracy. Manual division is insufficient for high-frequency execution; utilize automated feeds for real-time results.
Why is SPY not exactly 1/10th of the SPX price?
Structural variables prevent a permanent 1/10th ratio. The 0.0945% annual expense ratio and quarterly dividend distributions create a persistent price drag on the ETF. SPX is a price-return index and remains unaffected by these custodial costs. Market hours and interest rates further contribute to this divergence.
How often does the SPX to SPY ratio change?
The ratio fluctuates continuously during active market sessions. High-frequency traders require data refreshed every six seconds to capture micro-movements in the basis. Static daily updates fail to account for intraday liquidity shifts and rapid price discovery. Constant monitoring is necessary to maintain strike parity.
What is the best tool for converting SPX strikes to SPY?
A dedicated Real-Time SPX to SPY Strike Price Converter is the most effective utility for day traders. It automates the division and rounding protocols. This tool maintains 0DTE strike mapping precision by synchronizing the spx spy price relationship with live market feeds at high frequencies.
Does the SPX SPY relationship change during market volatility?
High volatility expands the frequency and magnitude of ratio deviations. VIX spikes increase basis risk and create temporary liquidity imbalances in the ETF. These factors often force the ratio outside the standard 9.95 to 10.05 range; requiring constant recalibration to avoid execution drift.
How do dividends affect the SPX to SPY price relationship?
Dividends cause SPY to trade lower relative to the index on ex-dividend dates. SPX does not adjust for cash distributions. This divergence shifts the spx spy price relationship; necessitating ratio adjustments for the July 31, 2026, payment of $1.90 per share. Failure to adjust causes significant mapping errors.
Is SPX or SPY better for 0DTE options trading?
SPX is technically superior for tax efficiency and cash settlement. 0DTE traders benefit from Section 1256 contracts and 60/40 tax treatment. SPY is preferable for accounts with smaller capital requirements or those requiring granular 1-point strike increments. Selection depends on specific margin and tax requirements.
Can I use a static 10x multiplier for strike price mapping?
Reliance on a static 10x multiplier causes execution drift and capital inefficiency. Inaccurate mapping leads to PnL slippage and sub-optimal strike selection during high-volatility events. Precise execution requires applying the dynamic live ratio to every conversion to ensure the selected strike reflects the intended index level.