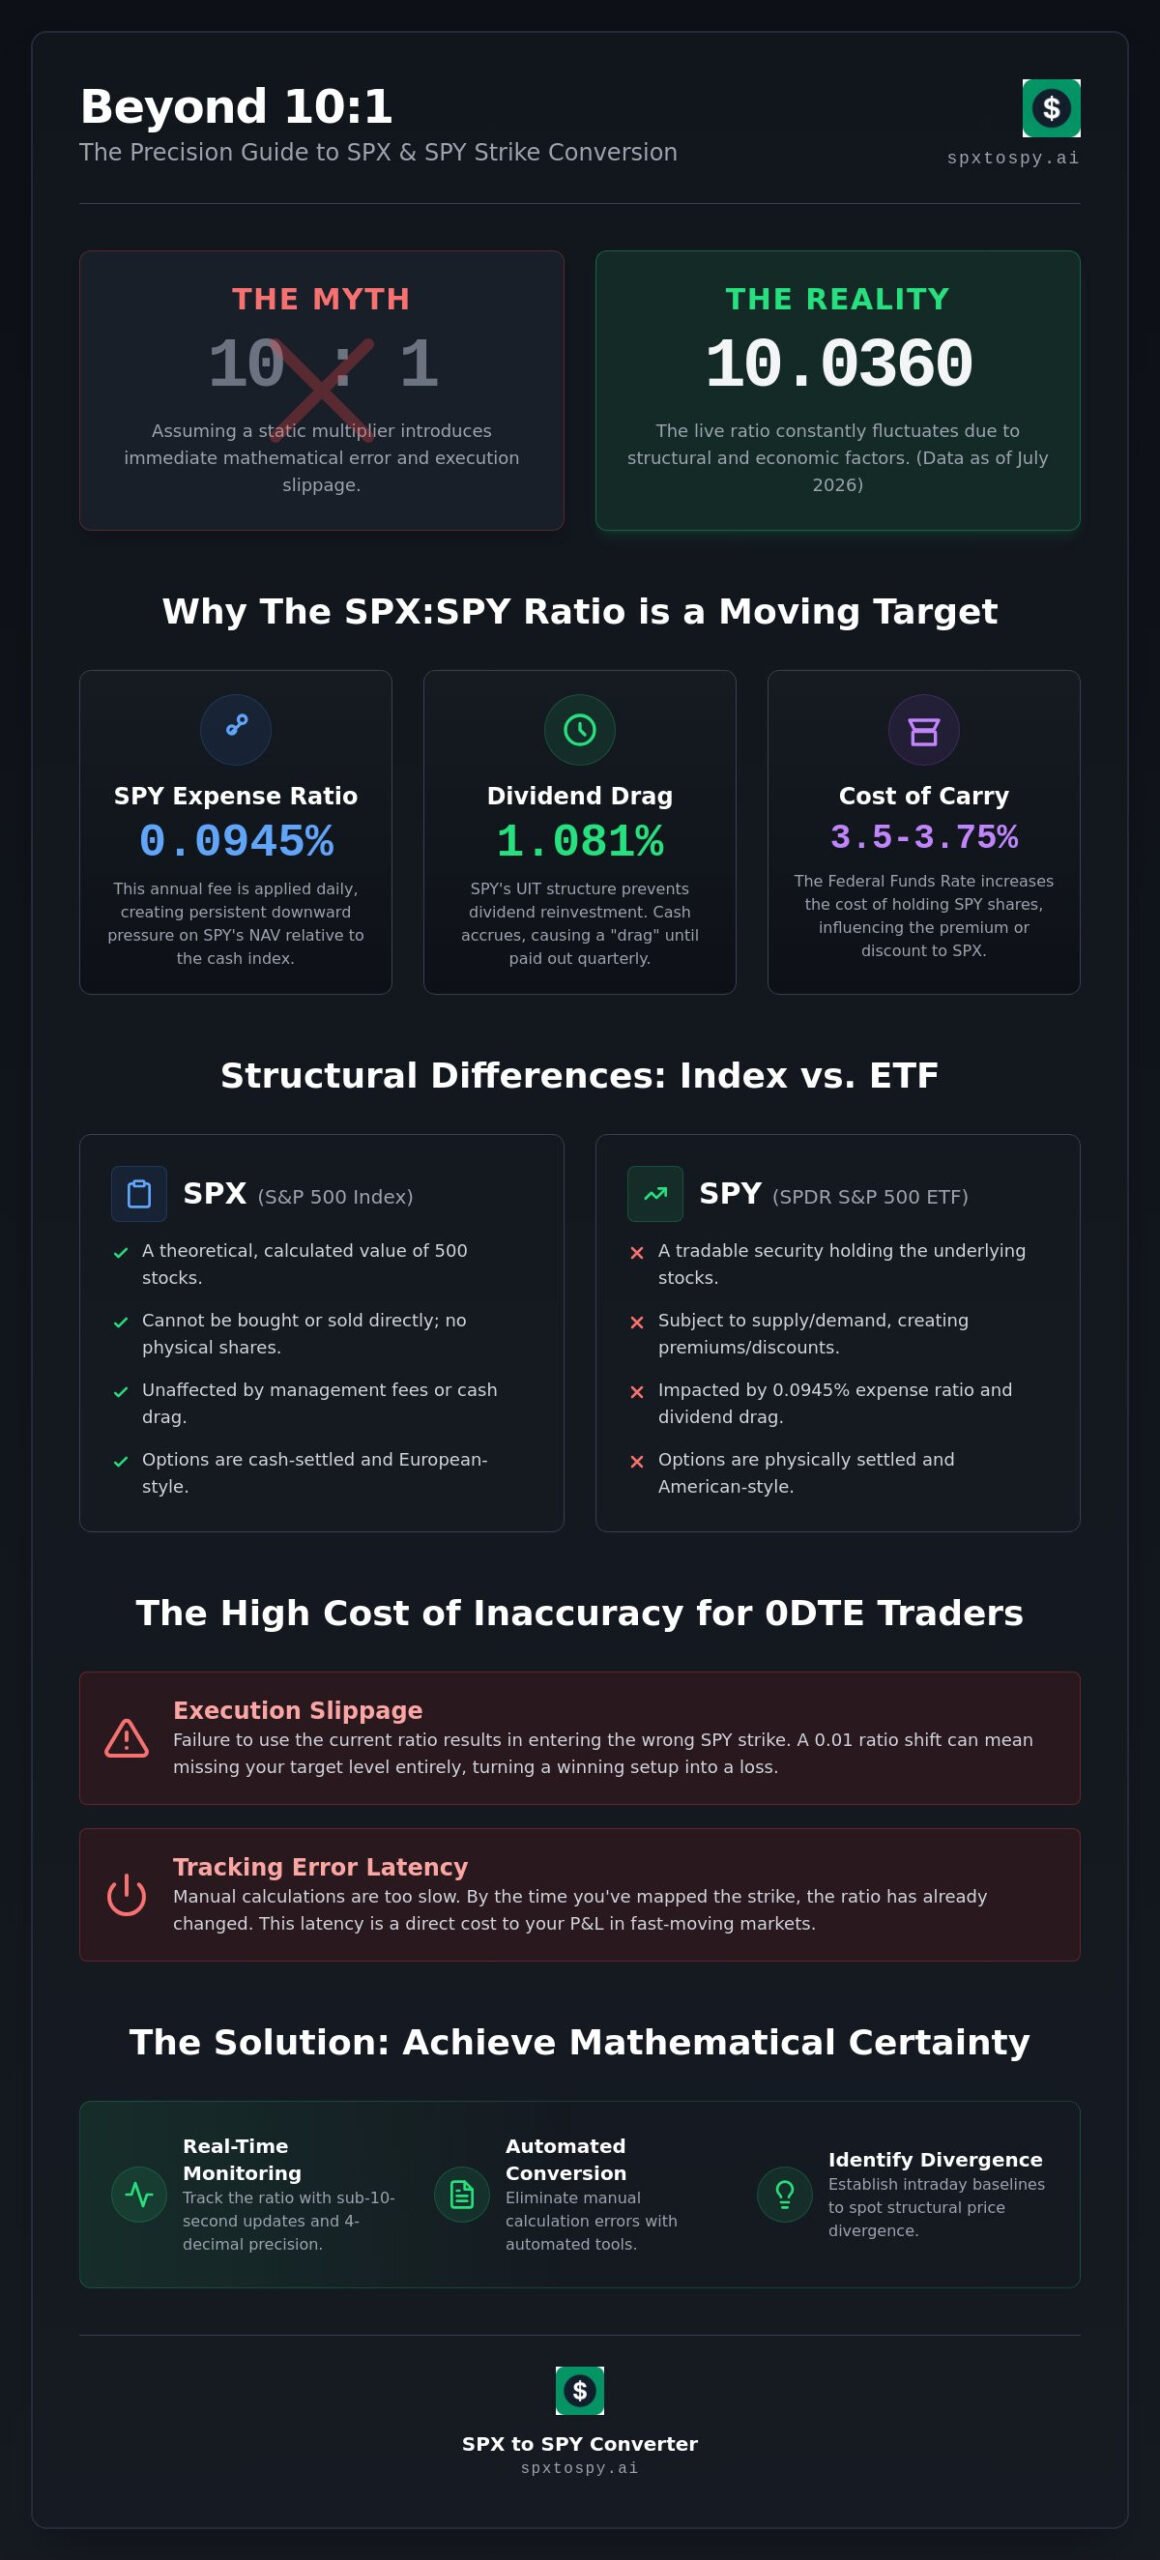
Assuming a static 10:1 multiplier for 0DTE options execution introduces immediate mathematical error into your strike mapping. Current market data from July 2026 indicates the live SPX to SPY ratio is approximately 10.0360; this discrepancy is driven by the 0.0945% SPY expense ratio and the structural cash drag inherent in its unit investment trust design. Monitoring spx spy ratio fluctuation in real time is the only method to mitigate execution slippage and ensure strike parity between the cash index and its physically settled counterpart. Manual calculations in high-frequency environments fail to account for these dynamic variables, resulting in imprecise positioning.
You understand that tracking error and dividend lag are direct costs to your P&L rather than theoretical risks. This article analyzes the intraday relationship between these instruments to provide a framework for zero-latency strike conversion. We examine how the current 3.50% to 3.75% federal funds rate and the 1.081% SPX dividend yield influence the cost of carry. You will gain the mathematical certainty required to map strikes with precision, reducing tracking error and eliminating the friction of imprecise ratio assumptions.
Key Takeaways
- Establish intraday baselines by identifying structural divergence between SPX cash and SPY ETF pricing.
- Account for the 0.0945% expense ratio and dividend drag to invalidate the 10:1 theoretical constant.
- Monitor spx spy ratio fluctuation to maintain precise strike parity and mitigate execution slippage in 0DTE markets.
- Deploy automated strike price conversion to eliminate manual calculation errors and reduce tracking error latency.
Understanding the SPX SPY Ratio Intraday Chart
The SPX SPY ratio defines the numerical relationship between the S&P 500 Index (SPX) and the SPDR S&P 500 ETF Trust (SPY). It functions as a real-time visualization tool for price divergence and convergence between cash indices and tradable instruments. Traders use this metric to map SPX technical levels to SPY strike prices during high-frequency 0DTE execution. Data currency is non-negotiable. Systems must refresh at sub-10-second intervals to provide actionable metrics. Any latency in monitoring spx spy ratio fluctuation results in immediate tracking error. This leads to imprecise strike selection and increased execution slippage.
The Mechanics of Index vs. ETF Pricing
SPX is a theoretical mathematical value. It derives from the weighted capitalization of 500 underlying equities. It has no physical shares and doesn’t trade on an exchange. Conversely, the SPDR S&P 500 ETF Trust is a tradable security. It operates as a unit investment trust (UIT). Unlike standard open-end funds, SPY’s UIT structure prevents it from reinvesting dividends internally. This creates a structural cash drag. The ETF’s price is also impacted by its 0.0945% gross expense ratio, which is applied daily to the NAV. Market supply-demand imbalances cause the ETF to deviate from the cash index’s theoretical value. These structural mechanics ensure the ratio remains a moving target throughout the trading session.
Visualizing Intraday Ratio Fluctuations
Intraday charts track spx spy ratio fluctuation with high decimal precision. The Y-axis scales to four decimal places. Monitoring shifts from 10.0360 to 10.0350 is standard procedure for professional desks. Trend identification reveals whether the spread is widening or narrowing. A widening ratio indicates SPX strength relative to the ETF. A narrowing ratio suggests SPY is regaining parity. These movements aren’t random. They’re responses to liquidity flows and interest rate costs. A ratio shift of 0.01 directly alters strike parity calculations. If you’re targeting a specific SPX level for a 0DTE entry, failing to adjust for the current ratio results in entering the wrong SPY strike. Precise visualization eliminates this risk. It provides the mathematical certainty required for scalping and high-speed positioning.
- Precision: Tracking to 0.0001 decimals.
- Latency: Updates required every 6 seconds.
- Parity: Mapping SPX 5600 to SPY 558.xx levels accurately.
Technical Factors Driving Intraday Ratio Deviations
Intraday ratio deviations stem from structural and market-driven variables. The 0.0945% annual expense ratio for SPY is applied daily. This creates persistent downward pressure on the ETF’s Net Asset Value relative to the cash index. Market liquidity imbalances also force temporary disconnects. Buy or sell order surges in SPY can push price away from theoretical SPX parity. Authorized Participants (APs) mitigate these gaps through arbitrage. They create or redeem shares to align SPY with the underlying NAV. However, this process isn’t instantaneous. High-frequency traders monitor S&P 500 Index Options (SPX) for settlement cues while tracking spx spy ratio fluctuation to identify these arbitrage windows. Cost of carry also influences the spread. The current federal funds rate of 3.50% to 3.75% increases the cost of holding SPY shares. This interest rate environment directly impacts the premium or discount between the cash index and the ETF.
Dividend Accrual and Ex-Date Impact
SPY’s Unit Investment Trust structure dictates dividend handling. It cannot reinvest cash internally. Dividends from 500 components accrue as cash within the trust. This creates “cash drag” for 30 to 43 days between the ex-dividend date and the payment date. The ratio expands as dividends accrue and contracts on the ex-dividend date. Traders should monitor the S&P 500 dividend schedule for 2026. Precise 0DTE strike mapping requires adjusting for the 1.081% yield impact. Failing to account for this shift results in strike selection errors during quarterly cycles. The ratio currently sits near 10.0360. This reflects years of cumulative dividend drag and expense deductions. Mathematical certainty requires adjusting strike targets by several ticks to maintain parity with the cash index during high-volatility sessions.
Liquidity Spikes and Execution Slippage
Execution slippage occurs during liquidity spikes. The opening 15 minutes often show erratic ratio behavior. Algorithms target these spreads. Low-volume prints in the ETF can suggest a ratio shift that doesn’t exist in the cash index. Identifying these “fake” moves is critical for scalping. Market participants often see the ratio widen during rapid SPX sell-offs as SPY liquidity thins. This creates a temporary tracking error. You can use a live market ratio tracking tool to filter noise and confirm valid price action. Reliable execution depends on distinguishing structural shifts from temporary liquidity imbalances. Automated converters eliminate the manual lag associated with these calculations. This is essential for 0DTE strategies where seconds determine entry quality.
The 10x Constant vs. Intraday Reality
The 10:1 multiplier is a retail approximation. It is mathematically inaccurate for high-frequency execution. Current data from July 2026 establishes the ratio at approximately 10.0360. This divergence stems from three decades of cumulative expense ratios and dividend handling within the SPY unit investment trust. While the S&P 500 Index serves as the benchmark, the ETF tracks the price through a physically settled mechanism subject to decay. Relying on a static 10.000 assumption creates immediate strike mapping errors. For 0DTE scalping, spx spy ratio fluctuation must be tracked to four decimal places. A shift of 0.0010 equates to approximately 0.50 points on a 5000-level index. This error margin exceeds the tight bid-ask spreads required for profitable 0DTE positioning.
Tracking error isn’t a constant. It’s a dynamic intraday variable. Daily deviation from the 10x mean is standard. Historical drift shows the ratio expanding from parity at SPY’s 1993 inception to the current 10.0360 level. This expansion is permanent. It’s driven by the 0.0945% annual expense ratio. Traders must quantify this daily deviation to maintain mathematical certainty. Failure to do so results in executing at suboptimal strikes. This increases the probability of pinning risk or missing fills entirely. Precise mapping requires zero-latency data feeds to account for these structural shifts. Traders seeking a comprehensive technical reference for managing these variables should review the 0DTE SPX SPY ratio framework for real-time strike price mapping, which addresses Gamma risk exposure and the impact of 2026 margin systems on intraday liquidity.
Calculating SPY Strike Equivalents
Precision execution dictates the base formula: SPX Price / Current Intraday Ratio = SPY Strike Equivalent. Apply live ratios to index resistance levels. For example, mapping SPX 5400 resistance. If the ratio is 10.005, the SPY target is 539.73. If the ratio shifts to 9.995, the target becomes 540.27. This 0.54-point delta represents multiple strike intervals in the SPY options chain. Use spx spy ratio fluctuation metrics to calibrate limit orders. Adjust targets based on whether the ratio is widening or narrowing during the session. This ensures your SPY position aligns with SPX technical triggers. Traders who require a deeper technical breakdown of SPX options to SPY equivalent precision strike mapping will find a clinical framework for zero-error conversion that accounts for dividend-adjusted deviations and the updated CBOE Options Regulatory Fee structure.
Managing Spread and Slippage
Accounting for the SPY bid-ask spread is mandatory. Convert SPX levels to the SPY mid-price first. Then adjust for the current spread. High-lot-size executions require verification protocols. Cross-reference the converter output with live tape prints. Monitor the trend of the ratio. A narrowing ratio during an uptrend suggests SPY is leading. A widening ratio indicates index-heavy buying. Adjust limit orders to capture these micro-inefficiencies. Eliminate manual entry lag. Use automated tracking to maintain zero-latency strike mapping. This reduces slippage and ensures strike parity in fast-moving 0DTE markets.
High-Frequency Execution Protocols for Ratio Tracking
High-frequency 0DTE execution requires a structured protocol to maintain strike parity.
Step 1: Monitor the spx spy ratio for scalping to establish a current session baseline. This baseline serves as the multiplier for all intraday conversions.
Step 2: Identify SPX technical levels. Focus on support, resistance, and VWAP. These index-level data points are the primary triggers for trade entry.
Step 3: Utilize the spxtospy.ai converter to translate theoretical SPX targets into precise SPY strikes. This removes the risk of manual calculation error in fast markets.
Step 4: Cross-reference the live ratio with the SPY option chain for liquidity verification. Check open interest and bid-ask spreads at the target strike.
Step 5: Execute the day trading spx spy conversion via the brokerage terminal. Continuous tracking of spx spy ratio fluctuation is mandatory during this sequence. Ratios shift in seconds. Latency in mapping results in immediate execution slippage.
Mean Reversion Strategies in the Ratio
Ratio extremes signal temporary price divergence. Identify deviations from the 10.0360 baseline. Trade the “snap-back” as the ETF aligns with the index NAV. This is an arbitrage-adjacent strategy. It exploits micro-inefficiencies between the cash index and the tradable trust. Manage risk if the ratio trends away from historical norms. Sustained trends indicate structural shifts or significant dividend accrual cycles. Don’t fight a trending ratio. Wait for consolidation before assuming mean reversion. Use a live market ratio tracking tool to confirm these deviations before committing capital.
Volatility Windows and Ratio Stability
Macro events trigger rapid spx spy ratio fluctuation. FOMC and CPI data releases cause immediate spikes in tracking error. Ratio charts lose reliability during extreme circuit-breaker events. High volatility halts the arbitrage mechanism used by Authorized Participants. Safe-trading protocols dictate waiting for ratio stabilization post-data release. This preserves capital. It ensures strike parity is restored before entry. Low-liquidity periods also distort the ratio. Avoid high-lot-size executions during these windows. Spreads widen. Slippage increases. Mathematical certainty requires stable data inputs. Reliability depends on the frequency of the data feed. Sub-10-second refreshes are essential for 0DTE precision.
- Protocol: Baseline, Level, Convert, Verify, Execute.
- Risk: Avoid execution during circuit-breaker events.
- Precision: Map strikes using four decimal points.
Optimizing Strike Mapping with the spxtospy.ai Converter
Manual calculation is a primary failure point in 0DTE execution. Automation eliminates this risk. The spxtospy.ai converter provides instantaneous strike parity by processing live data feeds. 6-second refresh intervals match the requirements of high-frequency trading. Accuracy is guaranteed through direct integration with market NAV and index pricing. This tool mitigates the impact of spx spy ratio fluctuation during rapid price discovery. Cognitive load is reduced. Precision is increased. Traders don’t need to manually adjust for the 0.0945% expense ratio or the 1.081% dividend yield. The software handles these technical variables in the background.
While reducing cognitive load through automation is essential, maintaining peak mental performance is just as critical for traders; those seeking to balance high-stakes professional demands with personal well-being should visit Hope Therapy Center for specialized support.
Features of the Real-Time Converter
The interface prioritizes functional efficiency. Instant strike mapping is available for both call and put chains. Live ratio tracking is displayed as a primary data point. This ensures session awareness regarding structural divergence. The design is zero-fluff. It’s optimized for active trading desks where screen real estate is at a premium. Data points are delivered in a modular, high-contrast format for rapid scanning. Strike identification occurs in milliseconds. This is critical for 0DTE scalping where slippage is a direct cost. The Y-axis precision of 0.0001 is maintained across all calculations. This ensures every 10-cent move in SPY is correctly mapped to its SPX equivalent.
Integration into a Trading Workflow
System setup requires positioning the spx to spy converter adjacent to charting software and brokerage terminals. Use the tool to verify broker-provided strike equivalents. Broker platforms often utilize stale multipliers that don’t account for intraday tracking error. A final verification protocol is essential. Before every 0DTE entry, traders must confirm the current ratio and the mapped strike. This process ensures the position aligns with SPX technical levels despite spx spy ratio fluctuation. Mathematical certainty replaces heuristic guesswork. The protocol includes:
- Identify SPX target level.
- Input level into the converter.
- Verify mapped SPY strike against the live ratio.
- Cross-reference the 6-second refresh timestamp.
- Execute limit order via brokerage.
Data integrity is the foundation of the 0DTE workflow. The converter utilizes high-precision feeds to ensure the 10.0360 ratio is reflected accurately. This eliminates the 10:1 myth from the decision-making process. Reliability is confirmed through constant uptime and sub-10-second updates. Professional execution demands this level of technical rigor. Using automated tools is the only way to maintain parity in the current 3.50% to 3.75% interest rate environment.
Achieving Zero-Latency Strike Parity
Precise execution in 0DTE markets requires the total elimination of mathematical heuristics. Static 10:1 assumptions ignore the reality of spx spy ratio fluctuation driven by the 0.0945% SPY expense ratio and quarterly dividend accruals. You’ve identified that tracking error is a dynamic variable, not a fixed constant. Maintaining strike parity between the cash index and the ETF depends on sub-10-second data currency and four-decimal precision. Manual mapping in high-volatility windows results in execution slippage and suboptimal positioning.
Automated tools provide the necessary mathematical certainty for high-frequency trading desks. Use a dedicated utility to verify broker-provided equivalents and filter out liquidity-driven noise. This ensures your SPY entries align perfectly with SPX technical triggers. Access the Real-Time SPX to SPY Converter Now. This precision-engineered utility for 0DTE traders features ratios refreshed every 6 seconds. It’s a free technical utility designed for active day trading desks. Deploy these metrics to ensure your strike mapping remains accurate throughout the session.
Frequently Asked Questions
How often does the SPX:SPY ratio change intraday?
The ratio updates continuously as market participants trade SPY on the secondary market. Professional systems refresh these data points at sub-10-second intervals to maintain execution precision. These fluctuations are driven by shifting liquidity and micro-inefficiencies between the cash index and the tradable ETF. Constant monitoring is required for high-frequency 0DTE positioning.
Is the SPX to SPY ratio always exactly 10 to 1?
No. The 10:1 multiplier is a retail approximation that fails to account for structural decay. As of July 2026, the live ratio is approximately 10.0360. Factors such as the 0.0945% annual expense ratio and dividend drag ensure the ETF price remains lower than one-tenth of the index. Relying on a static 10x constant results in strike mapping errors.
Why do I need a live ratio chart for 0DTE options?
Live charts provide the mathematical certainty required for zero-latency strike selection. 0DTE traders use these metrics to map SPX technical resistance levels to specific SPY option strikes. Tracking spx spy ratio fluctuation in real time eliminates manual calculation lag. It ensures your limit orders align with current market NAV rather than a stale theoretical multiplier.
What causes the SPY ETF to diverge from the SPX index price?
Divergence is primarily driven by the daily deduction of management fees and the structural handling of dividends. SPY is a tradable Unit Investment Trust subject to supply-demand imbalances, while SPX is a theoretical mathematical value. Interest rate environments also influence the cost of carry. These variables create a persistent tracking error that expands over long-term horizons.
How do dividends affect the SPX:SPY intraday ratio?
Dividends create a cash drag within the SPY trust structure. The ratio expands as underlying components accrue dividends and contracts sharply on ex-dividend dates. With the S&P 500 dividend yield at approximately 1.081%, traders must adjust strike targets during quarterly cycles. Failure to account for these shifts leads to selecting strikes that lack parity with the cash index.
Can I use the SPX:SPY ratio to find arbitrage opportunities?
Yes. Significant deviations from the historical mean signal temporary price disconnects. Traders exploit these gaps by identifying “snap-back” moves as the ETF price aligns with the index NAV. This strategy requires sub-10-second data refreshes to capture micro-inefficiencies. Success depends on distinguishing between structural ratio shifts and temporary liquidity-driven spikes.
What is the best tool for real-time SPX to SPY strike conversion?
The spxtospy.ai converter is the standard tool for automated mapping. It utilizes 6-second refresh intervals to match the speed of 0DTE markets. The interface is precision-engineered for active trading desks to eliminate the risks of spx spy ratio fluctuation. It provides a zero-fluff environment for identifying strike parity without manual calculation errors.
How does decimal precision in the ratio affect my SPY strike price?
Precision to four decimal places is essential for 0DTE scalping. A ratio shift of 0.0010 equates to a 0.50-point move on a 5000-level index. This delta often represents multiple strike intervals in the SPY options chain. Inaccurate rounding results in executing at suboptimal strikes, which increases your tracking error and reduces overall trade profitability.